 "bob and john" (bobandjohn)
12/18/2019 at 09:58 • Filed to: None
 3
3
 21
21|
"bob and john" (bobandjohn)
12/18/2019 at 09:58 • Filed to: None | 3
| 21 |
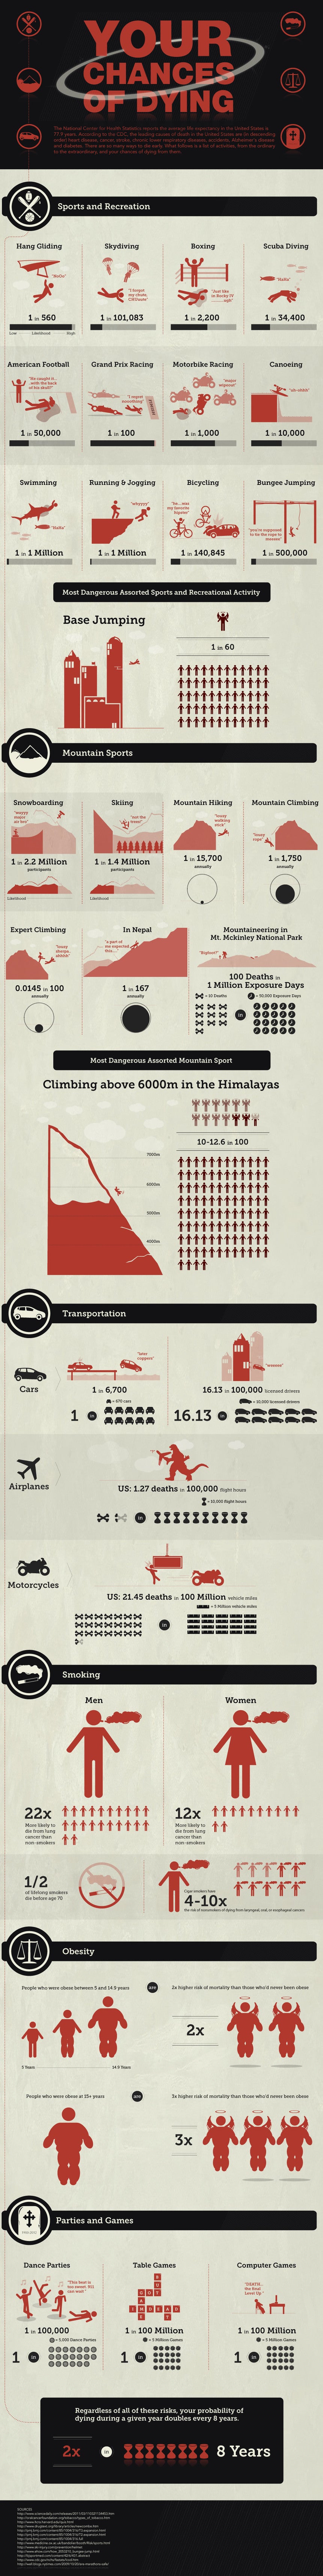
I didnt realize hang gliding was so dangerous....
 benjrblant
> bob and john
benjrblant
> bob and john
12/18/2019 at 10:09 |
|
Sorry, I didn’t find shit posting to oppo. What’s that stat like?
 Tekamul
> bob and john
Tekamul
> bob and john
12/18/2019 at 10:11 |
|
A lot on here doesn’t make sense. In the cases that have the units spelled out it’s ok (1.27 per 100,000 flight hours). But 1 in 6,700 cars...huh?
 Arch Duke Maxyenko, Shit Talk Extraordinaire
> bob and john
Arch Duke Maxyenko, Shit Talk Extraordinaire
> bob and john
12/18/2019 at 10:12 |
|
Unimbiggened, don’t break O ppo
 Thomas Donohue
> bob and john
Thomas Donohue
> bob and john
12/18/2019 at 10:13 |
|
Why are the car and bike statistics in three different metrics???
1 in 6700 (Cars?)
16 per 100,000 licensed drivers
21 per 100,000,000 vehicle miles (which seems very high. or low)
|
benjrblant
> Tekamul
12/18/2019 at 10:13 |
|
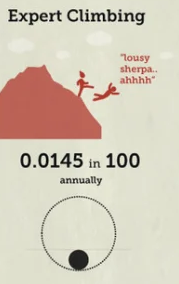
The variable rates throw me off too. 1 in 2.2 million or 0.0145 per 100? c’mon. If you’re not using a common numerator, at least use a common denominator.
 MasterMario - Keeper of the V8s
> bob and john
MasterMario - Keeper of the V8s
> bob and john
12/18/2019 at 10:14 |
|
This is a really cool infographic but a few items annoyed me
1. This is not canoeing
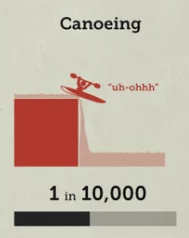
2. Why is this not “1 in 7000" like everything else?
 Dr. Zoidberg - RIP Oppo
> bob and john
Dr. Zoidberg - RIP Oppo
> bob and john
12/18/2019 at 10:16 |
|
People who are obese after 15 years [are] three times higher risk of mortality than those who’ve never been obese
Pretty sure we’re all gonna die, whether you’re fat or not. You’re not 3 times more likely to die if you’re fat; you just might die sooner.
 WRXforScience
> bob and john
WRXforScience
> bob and john
12/18/2019 at 10:16 |
|
How could hang gliding not be dangerous? At best it’s a controlled crash and when things go wrong it’s an uncontrolled crash.
|
bob and john
> Arch Duke Maxyenko, Shit Talk Extraordinaire
12/18/2019 at 10:20 |
|
You have the ban hammer, i have a *squints* stanley hammer
 Khalbali
> Thomas Donohue
Khalbali
> Thomas Donohue
12/18/2019 at 10:26 |
|
Yeah I was most curious to see bike vs car comparison, especially since my wife is very anti-me-g etting- a- bike.
 Cash Rewards
> bob and john
Cash Rewards
> bob and john
12/18/2019 at 10:31 |
|
That stat on Gran Prix racing has to be wrong. There's not a death every hundred races, right? Or ever 100 racers?
 Ash78, voting early and often
> bob and john
Ash78, voting early and often
> bob and john
12/18/2019 at 10:31 |
|
Hang gliding is nuts. The only thing worse is paragliding, which is like saying “I want all the danger of hang gliding, but can you add some of that sweet BASE jumping risk in there, too?”
|
bob and john
> Cash Rewards
12/18/2019 at 10:34 |
|
I mean...there have been 2 deaths in F1 and F2 in the past 5 years. Certianly less then 100 racers since.
 My X-type is too a real Jaguar
> bob and john
My X-type is too a real Jaguar
> bob and john
12/18/2019 at 10:40 |
|
Hang gliders? What is this an episode of CHiPs?
|
Cash Rewards
> bob and john
12/18/2019 at 10:52 |
|
Thats my confusion on the stat. If it’s of anyone is a given race, then what’s the time period? If someone died last race, but not the race before,I can say 1 in 2 if that’s my time period. But it would make sense to me to say that 2 people out of all the racers in each race (racers x races).
But even then, f1 ran 21 races this year. I’m guessing f2 the same. So we’re looking at over 200 races in 5 years. So you really got to define your stat in the worst way possible to generate that number, which I guess you can, and expecting to have that spelled out in an infographic is a bit much of me, I guess.
This is what 11 years of engineering schooling does to you. Show me methodology behind your numbers or piss off.
|
Dr. Zoidberg - RIP Oppo
> benjrblant
12/18/2019 at 11:04 |
|
Humans are recognized as presumably whole numbers. What does it mean to me if a fraction of one whole human dies out of 100? Pretty much nothing, I’d convert into a rational number like any sane person.
|
bob and john
> Dr. Zoidberg - RIP Oppo
12/18/2019 at 11:05 |
|
Right little ray of sunshine arent ya? LOL
 functionoverfashion
> Cash Rewards
functionoverfashion
> Cash Rewards
12/18/2019 at 11:31 |
|
Nah, it doesn’t take 11 years of engineering school. I was annoyed by the lack of explanation on most of these stats also.
 fintail
> bob and john
fintail
> bob and john
12/18/2019 at 12:15 |
|
I don’t exactly have an advanced degree in stats, but this bugs me somehow.
I guess if anything, it shows that we should all enjoy something today, tomorrow isn’t guaranteed.
 RallyWrench
> Dr. Zoidberg - RIP Oppo
RallyWrench
> Dr. Zoidberg - RIP Oppo
12/18/2019 at 12:57 |
|
And you will have eaten more pizza. Fair deal.
 thatsmr
> bob and john
thatsmr
> bob and john
12/19/2019 at 00:15 |
|
Jackie Gleason said something along the lines of “ my doctor told me if I don’t stop smoking, drinking, and eating so much i’m going to die. I said if I cant smoke, drink, and eat, Id rather be dead"