 "Torquelife" (torquelife)
04/22/2015 at 14:45 ē Filed to: None
 4
4
 7
7
 "Torquelife" (torquelife)
04/22/2015 at 14:45 ē Filed to: None |  4 4
|  7 7 |
Let me start with an observation so simple that Iíll spend the next few thousand words discussing it: thereís a direct correlation between speed and energy consumption.
!!! UNKNOWN CONTENT TYPE !!!
Find more !!!error: Indecipherable SUB-paragraph formatting!!! content at !!!error: Indecipherable SUB-paragraph formatting!!! and on Twitter !!!error: Indecipherable SUB-paragraph formatting!!! .
!!! UNKNOWN CONTENT TYPE !!!
In my last article about
!!!error: Indecipherable SUB-paragraph formatting!!!
, I introduced the basic concepts of analysis and the difference temperature could make on energy consumption for various types of powertrain architecture. I introduced three fuel economy drive cycle tests in that article, but a quick refresher. A graph of the drive cycle speeds versus time can be found
!!!error: Indecipherable SUB-paragraph formatting!!!
. UDDS simulates an urban driving environment and has an average speed of 19 miles-per-hour. HWFET is the traditional highway driving test, though relatively conservative in terms of speed.
For years, the Highway EPA mileage figure was an optimistic target, sometimes wildly so. In order to provide more accurate fuel economy figures, the EPA revised its testing methodology to include high speed, air-conditioning, and low temperature tests. The high speed test is known as the US06, and though it has the same 48 mph average speed as the HWFET, the highest speed reached during the cycle is significantly increased (80 mph vs 60) and the amount of acceleration is higher too.
Basically, we can look at the HWFET as an idealized highway driving scenario and the US06 as a fairly aggressive driving scenario, with real-world highway conditions falling somewhere in between the two. I provided a graph of energy consumption versus temperature for the UDDS cycle before ( !!!error: Indecipherable SUB-paragraph formatting!!! ), but using the data provided in !!!error: Indecipherable SUB-paragraph formatting!!! , we can create similar charts and graphs for the HWFET and US06 driving cycles as well.
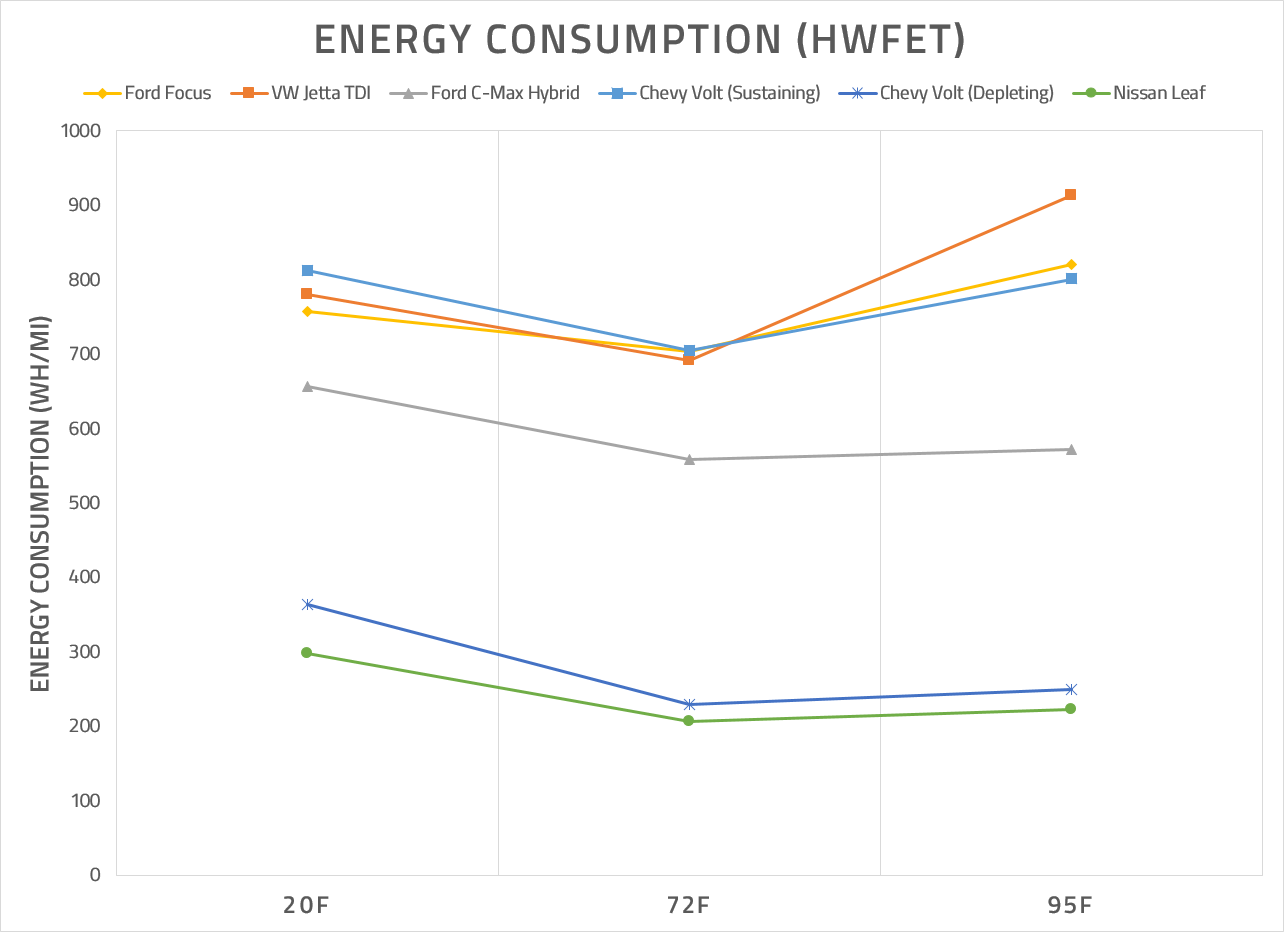
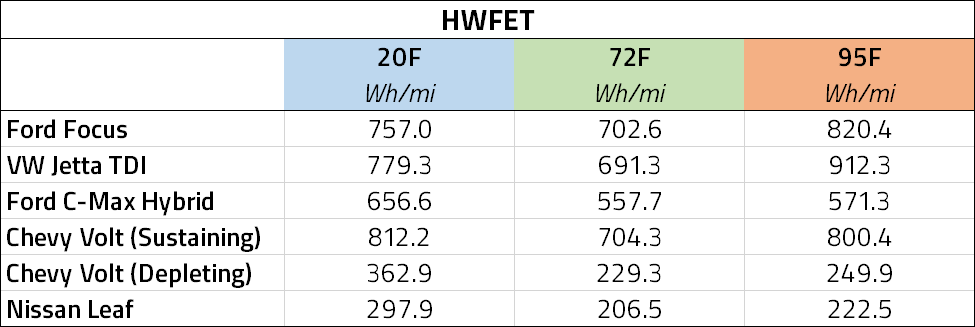
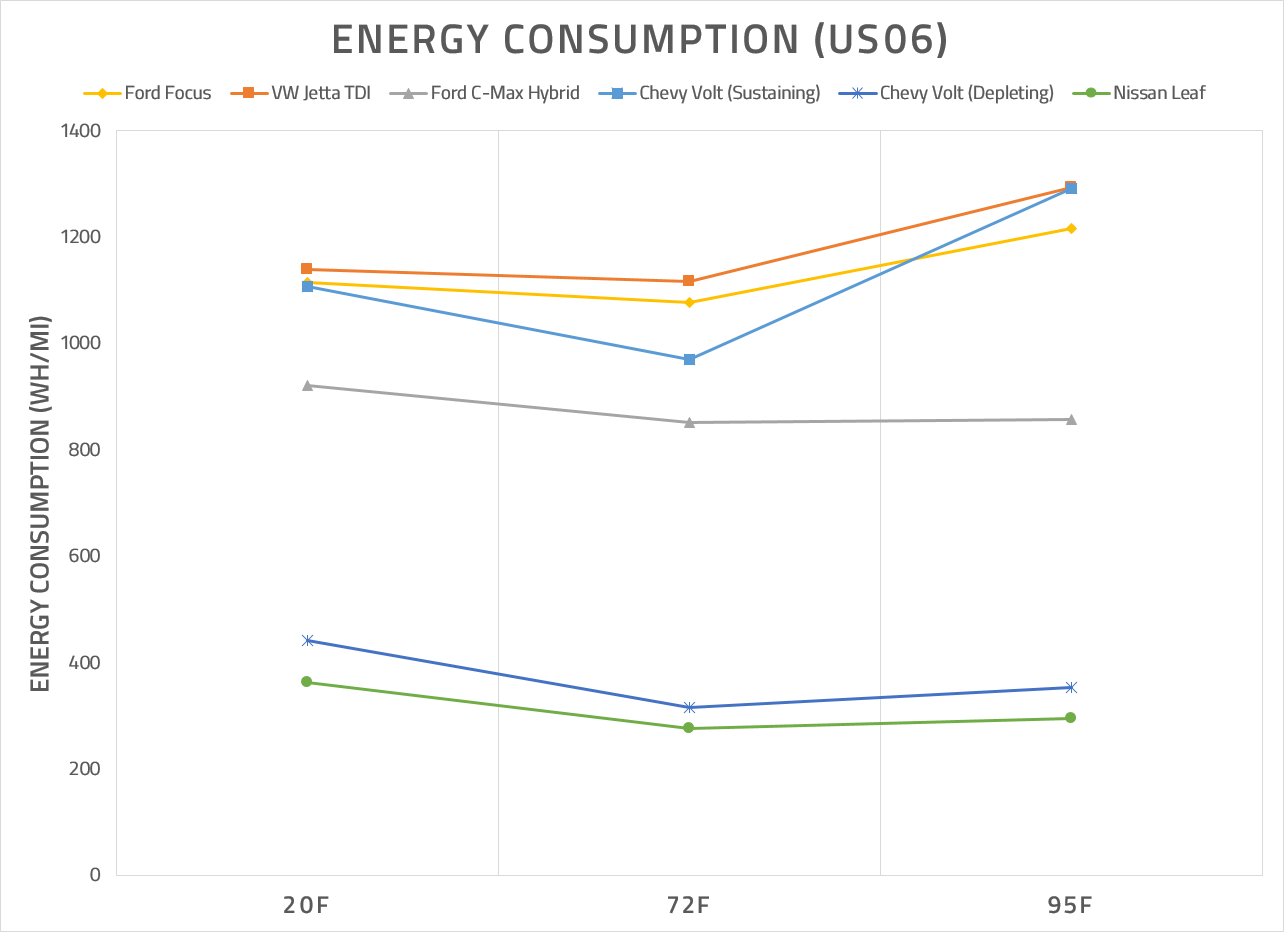
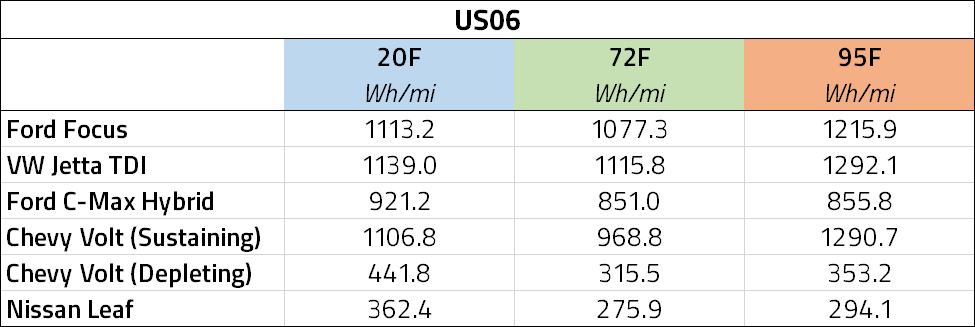
Energy consumption in the HWFET (left) and US06 (right) drive cycles.
!!! UNKNOWN CONTENT TYPE !!!
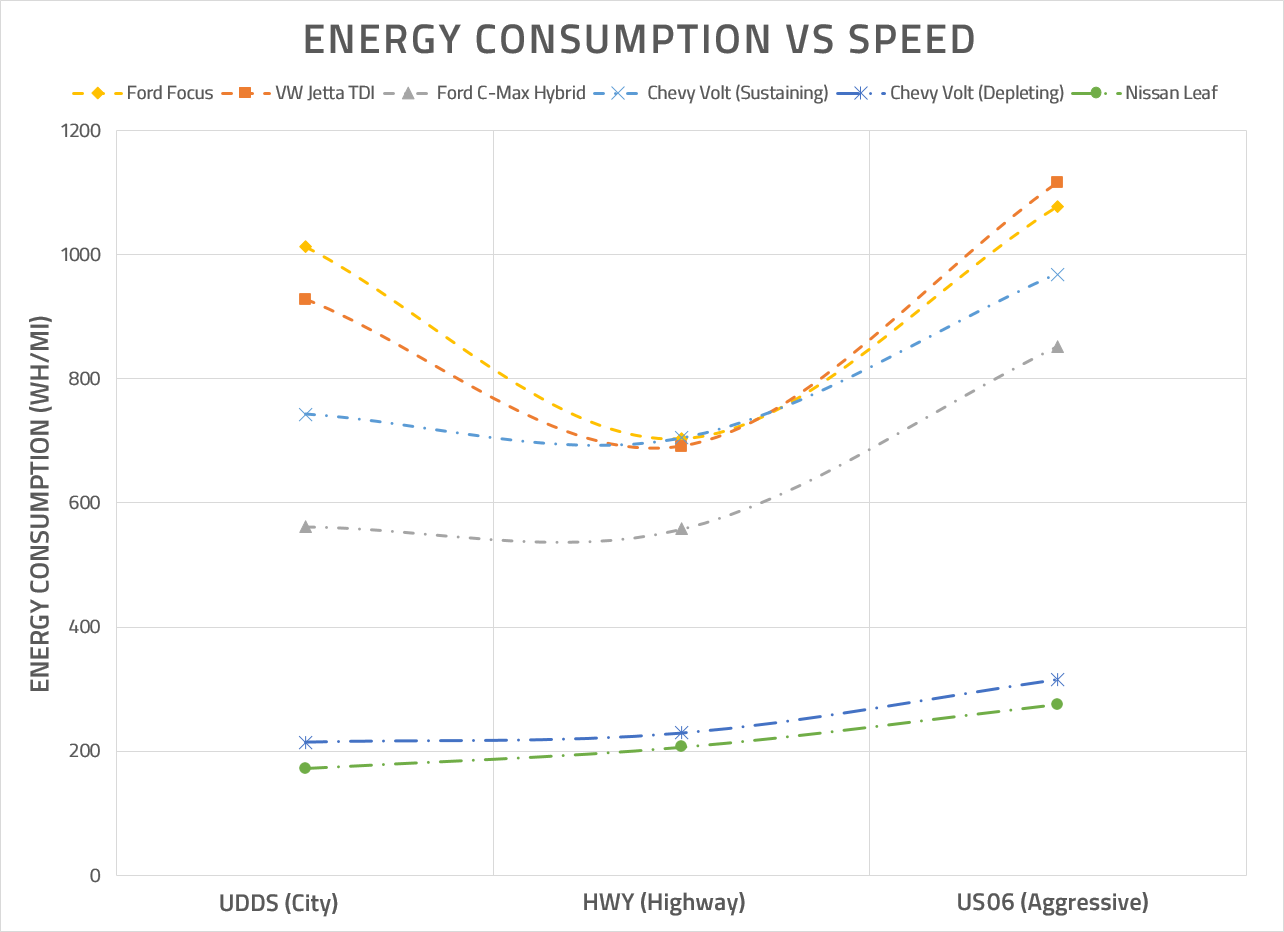
Thereís a lot of data here - legitimately dozens of articles can be derived from it, and at least one Masterís thesis. Letís start with an observation so simple that Iíll spend the next thousand words discussing it: thereís a direct correlation between speed and energy consumption.
On itís face, that statement seems pretty obvious. Which, okay, fair enough - this is just basic common sense, right? But letís actually look at this, taking our five vehicles at 72F with no auxiliary loads and analysing energy consumption during the UDDS, HWFET, and US06 cycles. The cycles are differentiated by more than average speed, and that isnít the only factor that matters in this analysis, but weíll get there.
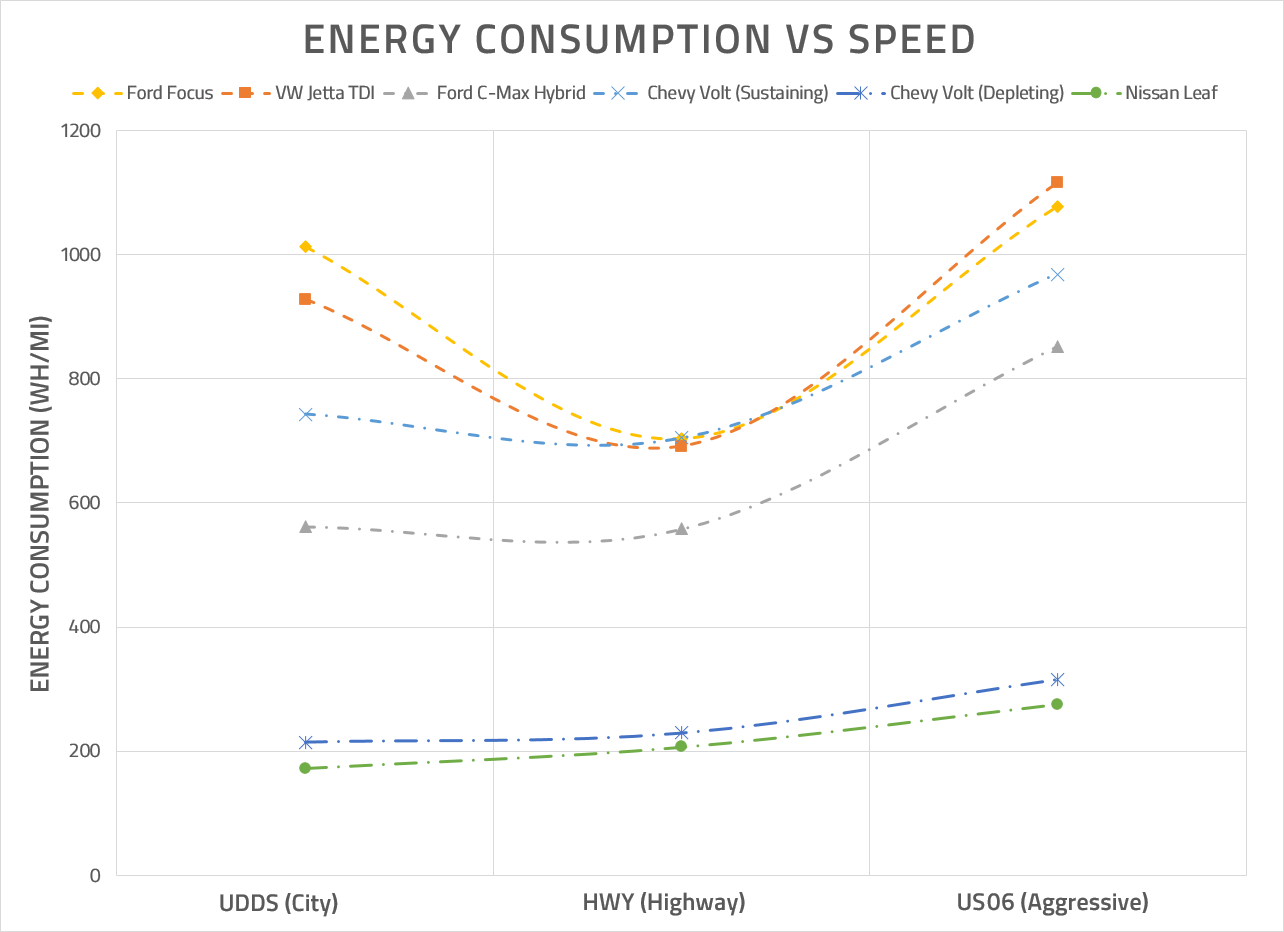
As expected, for the most part, speed and energy consumption do correlate. For the electric and hybrid vehicles in our suite of evaluation, the energy consumption delta between urban and highway speeds is not a lot; this is due to the low speed, start-stop nature of the UDDS cycle versus the higher, but constant speed of the HWFET. Itís worth noting here that while the absolute energy increase for the Leaf from UDDS to HWFET is small, percentage-wise itís a significant jump. Itís pretty clear that electric vehicles are very ideally suited to city driving environments; cars like the Leaf and Fiat 500e make a ton of sense as urban runabouts, even if theyíre not entirely practical to have as an only car.

In all cases, the jump from the HWFET to the US06 is significant. But thereís one pretty big outlier here: the conventional vehicles both have significantly higher energy consumption in the UDDS cycle than in the HWFET.
Internal combustion engines are far from ideal when it comes to city driving conditions. This is why, historically, weíve been conditioned to seeing highway fuel economy numbers that tend to be higher than city fuel economy by a significant amount. The reasoning is pretty simple - EPAís highway test is a pretty favorable loading condition for an internal combustion engine, with low engine output requirements and low engine speeds.
When a vehicle is traveling at highway speeds, itís typically in a higher gear and the engine is turning slower. The engine output required to maintain 60 mph on a relatively flat, smooth road is pretty minimal - the main forces that the engine has to work against are aerodynamic drag and the friction between the tires and road surface. The formulas used to calculate the aerodynamic resistance and rolling resistance are simple:

Letís go through this exercise using a normal car, say the Ford Focus, which has a drag coefficient of 0.297, frontal area of roughly 2.26 square meters, and weighs around 3000 pounds (Source:
!!!error: Indecipherable SUB-paragraph formatting!!!
). Depending on body style and configuration, that number can vary between 2800 and 3200, though for the SE automatic hatchback, tested weights seem to hover right around the 3000 mark. In kilograms, thatís 1360kg. Coefficient of rolling resistance for a normal tire is in the 0.010 - 0.015 range and between 0.006 and 0.010 for a low rolling resistance tire. For the purposes of this conversation, letís select Crr as 0.010 - the Focus has relatively small wheels and pretty conservative tires, at least in the more mainstream models. Rho (density of air) is roughly 1.225 kg/m^3 at 15 C at sea level, gravitational constant is 9.807 m/s^2, and letís say highway speed is equal to 60 mph or 26.8 meters per second.
Using the formulas above, we can see that the aero resistance comes out to 295 Newtons and rolling resistance comes out to 133 Newtons. At 60 mph, the resistance of the car equates to 15.4 horsepower . Youíll notice that in a car that comes with 160 horsepower out of the box, not a lot is being asked of the engine.
At low engine speeds, the engine isnít very efficient, but the key is that it doesnít really need to be. It doesnít require very much energy to output 15 horsepower, so even if that energy isnít very efficiently used, the overall energy consumption (or fuel economy) number looks pretty good.
In city driving, internal combustion engines have to deal with a large amount of idling and low speed acceleration, which are pretty much the least efficient conditions under which an ICE can operate. Fuel economy at idle is, of course, zero - at zero miles per hour, you will get zero miles per gallon, because you have traveled precisely zero miles. Glad weíve cleared that one up.
At low engine speeds, ICEs tend to have poor combustion efficiency due to the heat transfer of the engine. Basically, within a cylinder, higher heat transfer to the combustion chamber will reduce the combustion pressure and thus the amount of work done by the cylinder. The slower your pistons travel, the higher your heat transfer is, and thus the higher your specific fuel consumption is. This is the fuel consumption per amount of work done, a simple relationship of energy input versus work output. Itís inversely correlated with engine efficiency - the higher your efficiency, the lower your specific fuel consumption. At high engine speeds, mechanical efficiency is reduced due to increasing friction loss, correlating with the distance traveled by the pistons, and overall engine efficiency goes down with it. So peak efficiency (the point at which specific fuel consumption is lowest) actually happens midway through the rev range, usually at the torque peak. You can see a graph of specific fuel consumption versus RPM for a generic four-cylinder petrol engine at a variety of throttle positions in the image below, taken from a 1972 Repco engine service manual.
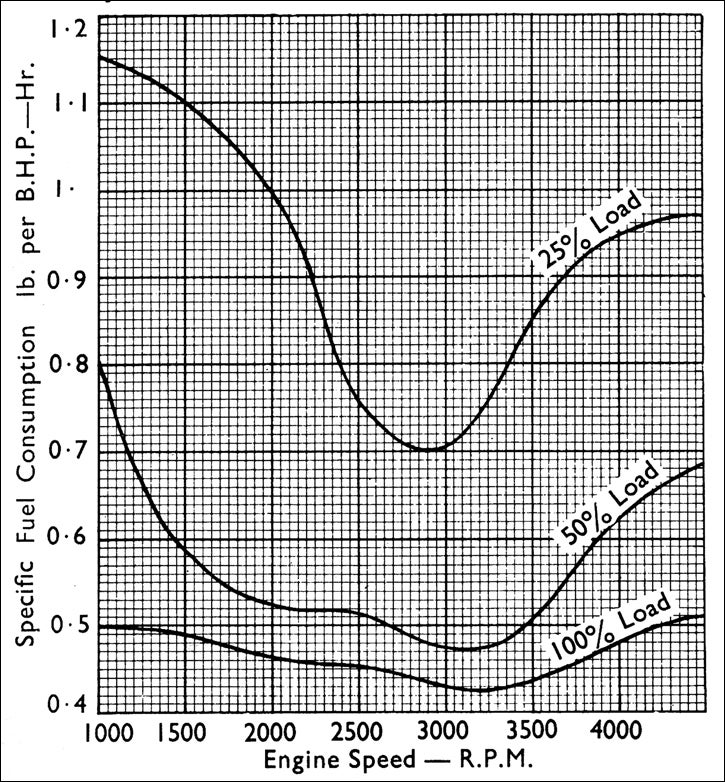
Specific fuel consumption versus RPM in a four-cylinder engine. Image: Repco, 1972.
!!! UNKNOWN CONTENT TYPE !!!
Internal combustion engines are good at running with a constant loading at the speed of peak efficiency. This, as youíll notice, describes almost no real-life driving scenarios. Literally, zero. Constant engine speed might be fine in a generator, but in a passenger vehicle that would get very annoying, very quickly. If my carís engine constantly ran at its torque peak of 3500RPM, I might actually unbolt the transmission and light it on fire. So, basically what anyone driving a CVT considers doing every time they get onto the highway.
But in this, you can begin to see the engineering philosophies behind hybrid architectures. Using the ICE purely as a gasoline-powered generator to augment an electronic drive system seems like something that would play to the strengths of internal combustion, since the ICE can be run at a constant RPM and stay at peak efficiency. However, the NVH (noise, vibration, harshness) aspects need to be pretty carefully considered when choosing the size and power output of the ICE. This is fundamentally just the EREV (extended-range electric vehicle) or series hybrid model that is used by the Volt and the BMW i3.
Mild hybrid systems, like Hondaís Integrated Motor Assist, also start to make a lot of sense. The small electric motor sandwiched between the engine and transmission serves primarily to assist the ICE during acceleration and allow for the engine to shut off at idle. Basically, instead of a radical shift in the paradigm, the IMA system increases the efficiency of the powertrain by assisting or eliminating the loading conditions under which an ICE is least efficient. Itís a relatively noninvasive way of going about hybridization and always struck me as a very Honda solution to the problem.
So what can we take away from this? When weíre armed with this much data on the behaviour and characteristics of various powertrain types, itís actually a bit daunting to begin analysis because there are so many different avenues to explore. Having the graphs laid out in front of us, we can really begin to see the strengths and weaknesses of each type of powertrain. Electric powertrains really have an untouchable advantage in the city, while the turbodiesel has great fuel economy on the highway - even if that doesnít necessarily translate into an energy consumption advantage relative to a gasoline ICE. The hybrid sits pretty neatly between the EVs and conventional vehicles, but its advantage over conventional vehicles shrinks as speeds increase, particularly under aggressive load.
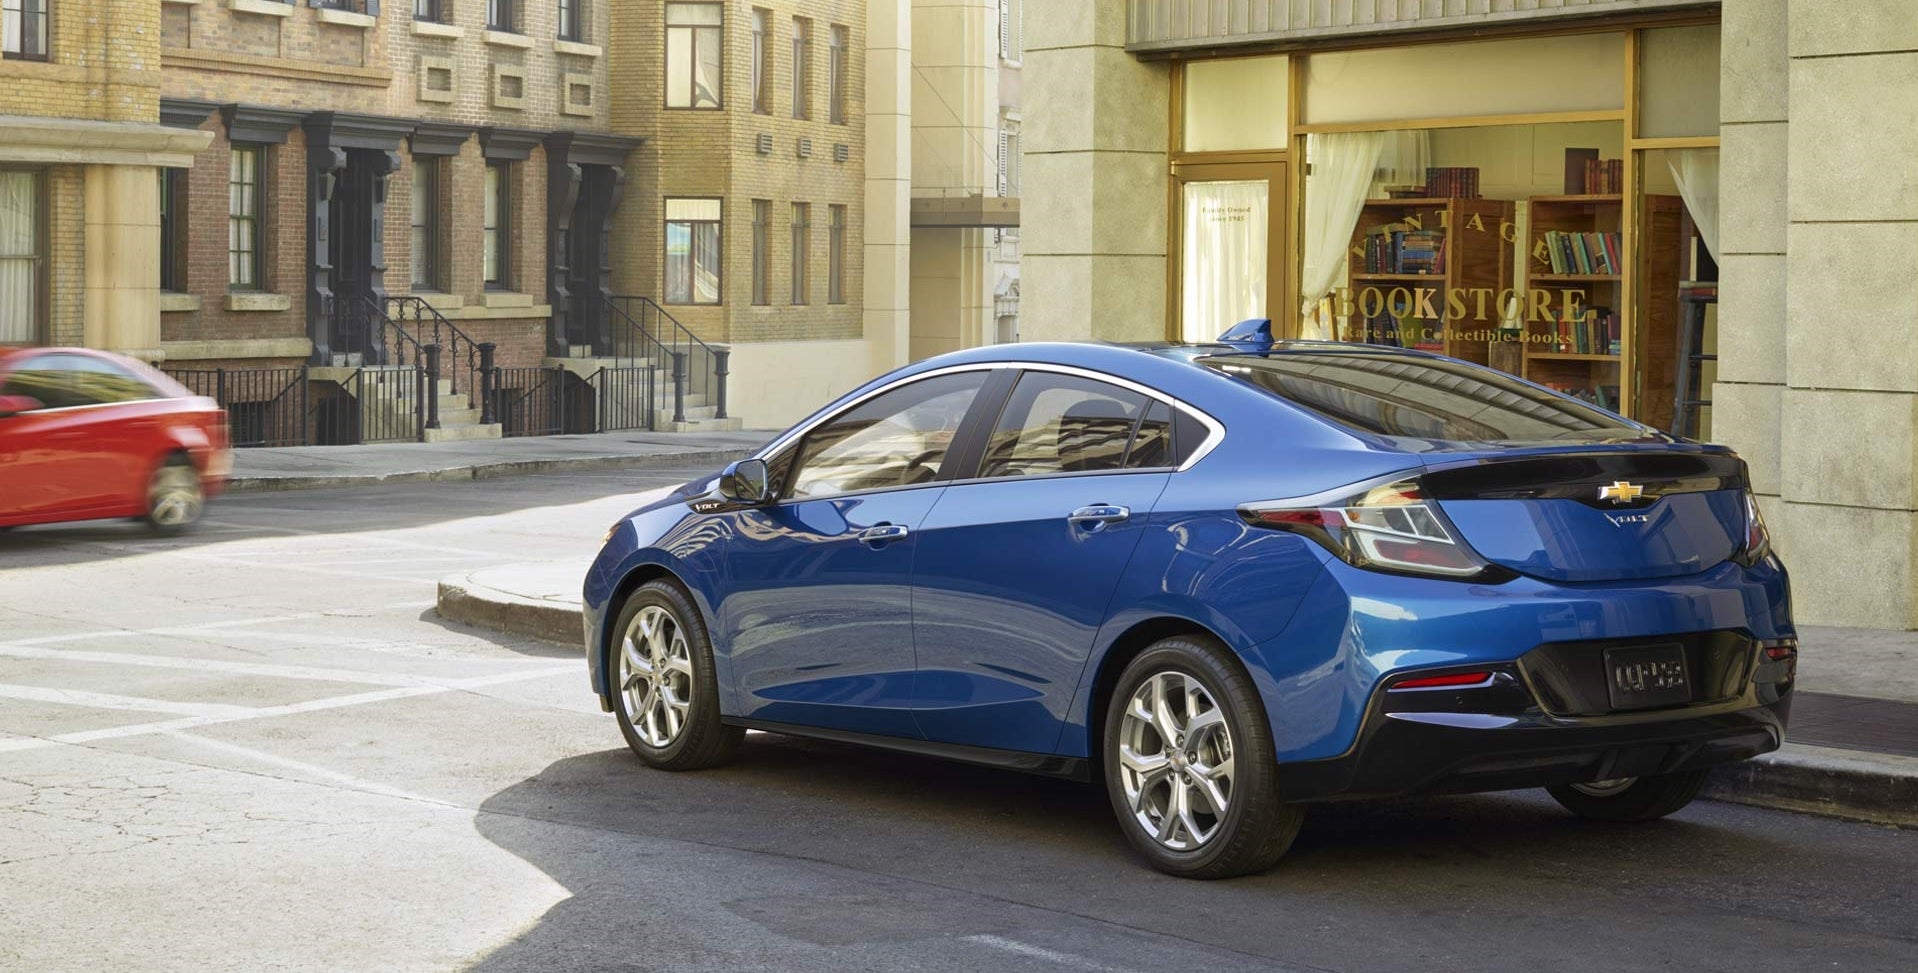
2016 Chevrolet Volt, press photo from Chevrolet. Image: General Motors (
!!!error: Indecipherable SUB-paragraph formatting!!!
)
The Volt is actually one of the most interesting aspects of this discussion for me. The Voltís energy consumption depends heavily on charge depleting mode - with range remaining, itís practically an EV, but as soon as it switches to charge sustaining mode, energy consumption mirrors a conventional gasoline-powered vehicle. Itís like a tale of two powertrains, and after examining this data, itís very interesting to think about how the behaviour of the current Volt might have influenced the engineering decisions behind the next generation Voltec powertrain that is coming in the 2016 Volt.
This data is from the Downloadable Dynamometer Database ( !!!error: Indecipherable SUB-paragraph formatting!!! ) and was generated at the Advanced Powertrain Research Facility (APRF) at Argonne National Laboratory under the funding and guidance of the U.S. Department of Energy (DOE).
 dogisbadob
> Torquelife
04/22/2015 at 14:50 |
|
Car and Driver did a test like this in the 70s. look up 20 mpg speed limit
 HammerheadFistpunch
> Torquelife
04/22/2015 at 14:50 |
|
Mobil for now but canít wait to read this
 Torquelife
> dogisbadob
04/22/2015 at 15:04 |
|
Not finding it, but if youíve got a link Iíd love to take a look!
 Justin Hughes
> Torquelife
04/22/2015 at 15:29 |
|
My Miata got 30mpg on the highway and 10mpg lapping Lime Rock Park. ĎNuff said!
 deekster_caddy
> Torquelife
04/22/2015 at 15:46 |
|
Great article! I have a Volt, and yeah itís highway milage is comparable to other modern 4 cylinder cars. But since the majority of my driving is in range-depleting mode, I get fantastic energy consumption. My typical commuting day uses an entire battery in the winter and a little less than half a battery in the summer. It depends how cold it is - in addition to cabin heat, it will also run the heat to keep the battery above a certain temp. Same for the A/C - on very hot days the A/C will run even if Iím not calling for it in the cabin to keep the battery below a certain temp. Those temperature protections are part of why they will warranty the drivetrain and battery to 100,000 miles.
Iíve had mine for a little over 2 years and have just under 35,000 miles on it already. Took it on a 4,000 mile trip last summer which killed my ďaverageĒ MPG.
Let me know if you have any questions about the Volt, Iím open for anything.
 dogisbadob
> Torquelife
04/22/2015 at 16:20 |
|
The issue is November 1977. I can scan it if I can find my copy (bought it on ebay a few years ago)
 BaconSandwich is tasty.
> Torquelife
04/22/2015 at 16:48 |
|
Very interesting read!
I really would like to improve my understanding of aerodynamics. It does make me wonder - what sorts of things can be done to help lower the coefficient of drag for a vehicle? Do things like flattened/recessed door handles and window wipers help much? If a person was to take an average vehicle but smooth out a lot of the smaller areas (like door handles, window wipers, make the windows sit perfectly flush with surrounding surfaces, etc.), would that help reduce drag at all?
Also, when using a traditional internal combustion engine as a generator: which ends up being more efficient - running an internal combustion engine attached to a regular transmission vs. using it as a generator? Running it as a generator does allow it to run at peak efficiency, but how much of that is lost when converting that energy back into electrical energy (which is then used to drive an electric motor)? My understanding is that large vehicles like trains and mining dump trucks do this not for efficiency, but because it is very difficult to create a transmission/clutch system that can take that amount of torque without breaking. Iíd be curious to know if anyone has some reasonably hard numbers on this.
It would also be interesting to see the effect of reducing vehicle weight with regards to fuel economy. I keep meaning to chart out how various car models have slowly increased in weight over time.