 "DCCARGEEK" (dccargeek)
10/15/2015 at 11:03 • Filed to: None
 0
0
 21
21|
"DCCARGEEK" (dccargeek)
10/15/2015 at 11:03 • Filed to: None | 0
| 21 |
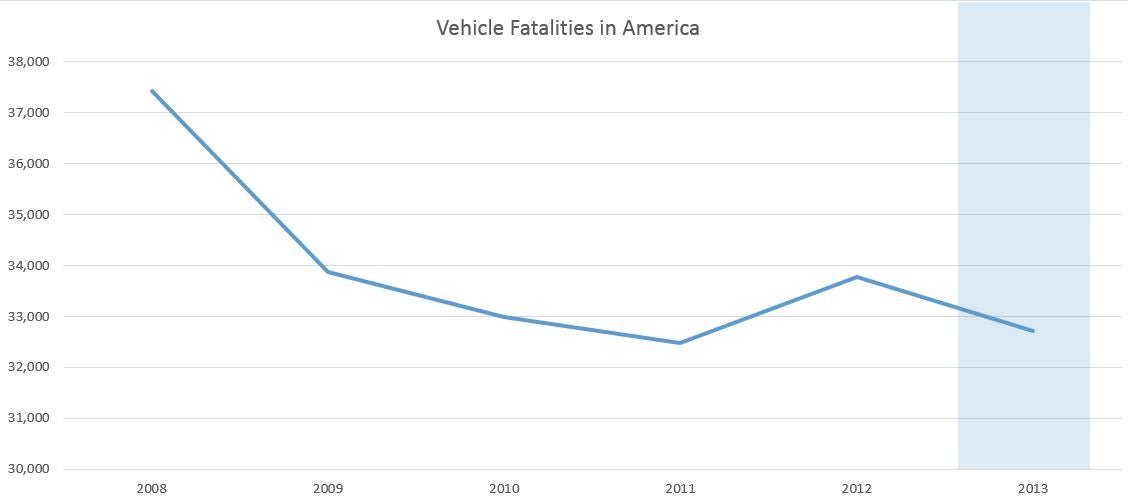
In 2013 there were 32,719 vehicle fatalities recorded in America – a number you’ve read before - yet rarely read about the details of those crashes. The number is tossed into a press release announcing a new piece of automotive safety technology or shouted to an automotive executive during a congressional hearing.
I pulled a few pieces of data from NHTSA’s Fatality Database in an attempt to visualize the various ways in which vehicles ended human lives in 2013.
Hopefully these charts will spark an interesting discussion aside from rants about better driver training (which I fully support!)
If you have any specific data questions, leave me a comment. I’ll do my best to answer it.
Bring on the Excel charts!
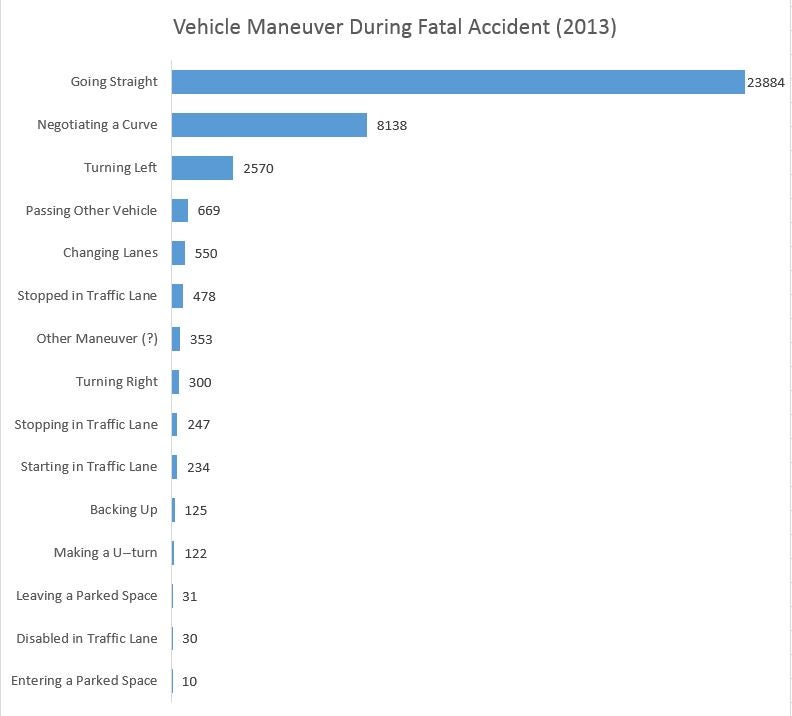
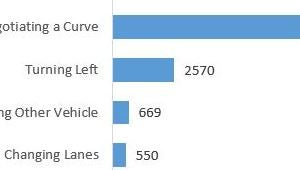
You’d think for a country that gave birth to NASCAR going straight, negotiating a curve and turning left would be easy - but that’s not the case as you can see in this graph.
And yes, it’s safe to say that the 10 of the deaths related to Entering a Parked Space are pedestrian deaths. I hope. If we are dying just parking our cars I’m giving up now and moving to Canada.
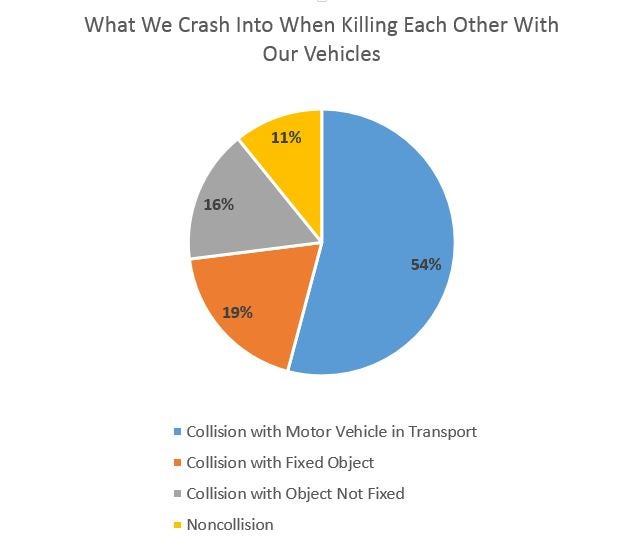
In 2013 hitting other vehicles in motion was still our number one target for fatal collisions. In case you’re curious what makes up Fixed Objects, it’s mostly trees, poles and walls.
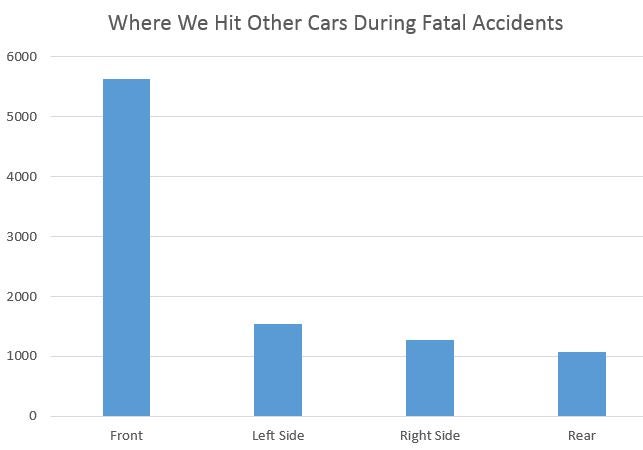
And when we’re hitting vehicles in motion we do it face-to-face. None of this sucker punch stuff.
So, now that we know what we’re doing with our cars when people are killed, lets shift our attention at who is being killed.
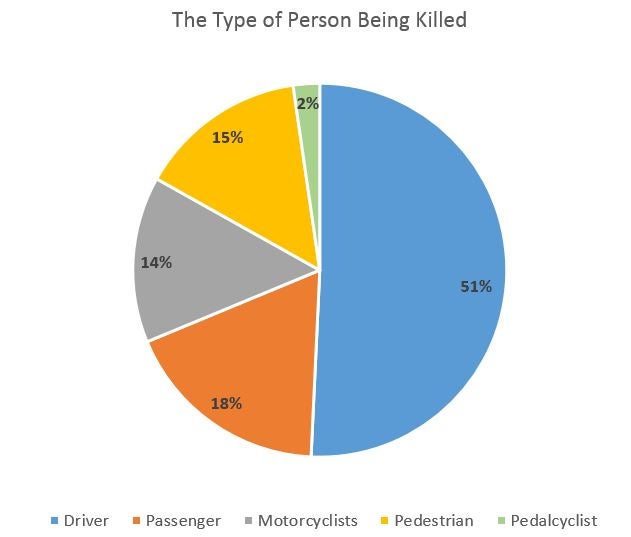
Those in the vehicle still make up 69% of those killed in vehicle accidents.
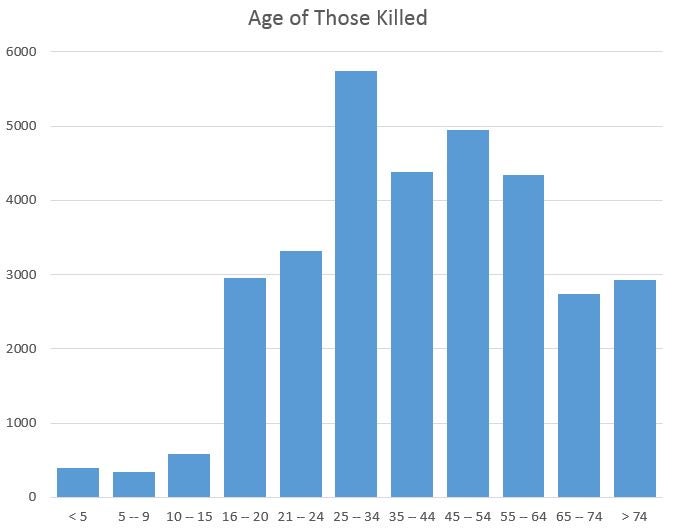
The age of those people who died is very important as this is a life ending event. As you can see, sadly, many are rather young, some very very young.
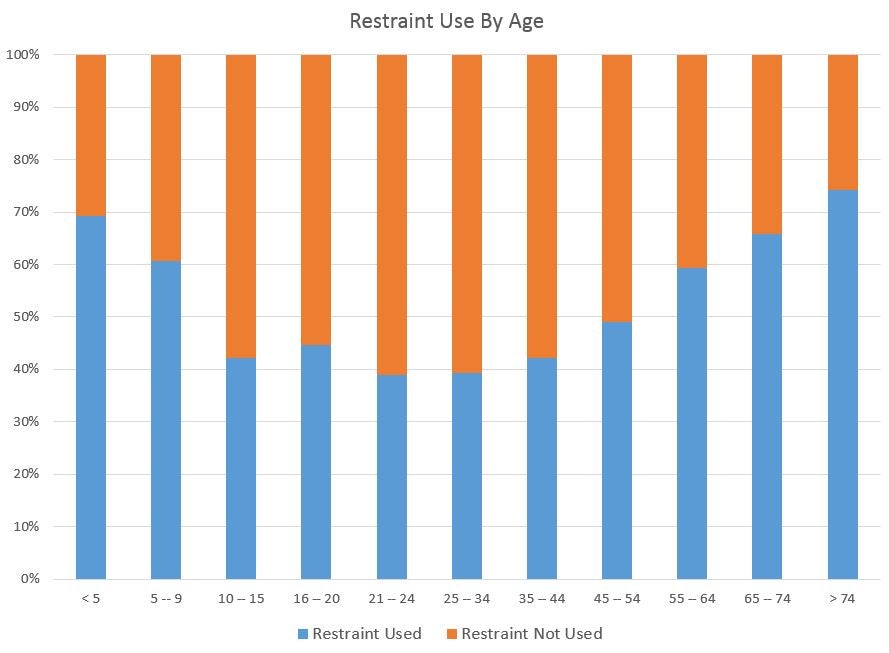
And of those people how many were wearing seatbelts? Ugh, barely half. Even worse look at the number of children not restrained. This is one of the saddest stories in the narrative of vehicle fatalities.
There you have it. A quick look into some of the details from data on vehicle fatalities for 2013 in America.
Want to get more nerdy facts and graphs on the auto industry? !!!error: Indecipherable SUB-paragraph formatting!!!
 CalzoneGolem
> DCCARGEEK
CalzoneGolem
> DCCARGEEK
10/15/2015 at 11:06 |
|
Article was much more literal than I expected.
 DoYouEvenShift
> DCCARGEEK
DoYouEvenShift
> DCCARGEEK
10/15/2015 at 11:13 |
|
I wonder how much of that was drug/alcohol related or distracted driving.
 Ash78, voting early and often
> DCCARGEEK
Ash78, voting early and often
> DCCARGEEK
10/15/2015 at 11:17 |
|
I’m from Gen X and the entire idea of going through life without condoms and seat belts was anathema.
And it wasn’t like one day I forgot to use a seat belt and was like “DAAAAMN, this feels so much better, I can’t believe what I’ve been missing all this time!”
 spanfucker retire bitch
> DCCARGEEK
spanfucker retire bitch
> DCCARGEEK
10/15/2015 at 11:18 |
|
I still can’t fucking believe that wearing a seat belt isn’t just a muscle reflex for over 90% of our country’s driving population.
It’s so god damn infuriating seeing these numbers as low as they are.
|
DCCARGEEK
> DoYouEvenShift
10/15/2015 at 11:19 |
|
Drug and alcohol I can pull easy.
Distracted, while captured via police reporting and loaded into FARS, isn't a very solid data set yet. Also, IIRC daydreaming is still the number one distracted driving sub category.
 BigBlock440
> spanfucker retire bitch
BigBlock440
> spanfucker retire bitch
10/15/2015 at 11:30 |
|
The post doesn’t make any mention about seat belt use for the general population, it very well may be a muscle reflex for 90% of the population (I don’t care to look it up though). The graphs just point out seat belt use for traffic fatalities, which if it actually is a life-saving feature, you would expect a greater portion of fatalities to be the ones not using it. Which for the more resilient type (not the very young or very old), you do. The population of the country is over 320,000,000 people, traffic fatalities are .01% of that. It’s a small sample size and not relevant for drawing conclusions on general seatbelt usage.
 Mark - Sixpots None The Richer
> DCCARGEEK
Mark - Sixpots None The Richer
> DCCARGEEK
10/15/2015 at 11:31 |
|

|
DoYouEvenShift
> DCCARGEEK
10/15/2015 at 11:32 |
|
I can imagine distracted driving would be some hard data to confirm. But we all know how often it can happen.
Also I had no idea daydreaming was an issue.
|
DoYouEvenShift
> spanfucker retire bitch
10/15/2015 at 11:35 |
|
Agreed! Driving without a sestbelt on feels like walking in shoes with the laces undone.
|
DCCARGEEK
> DoYouEvenShift
10/15/2015 at 11:37 |
|
I wrote at lenght about the accuracy of the data and where mobiles devices ranked in terms of their impact.
I also recently penned an article advocating for a pivot on the Don’t Text and Drive campaigns here:
http://dccargeek.com/why-talking-wh…
|
Mark - Sixpots None The Richer
> DCCARGEEK
10/15/2015 at 11:41 |
|
Honestly, those statistics are shocking me every time I see them.
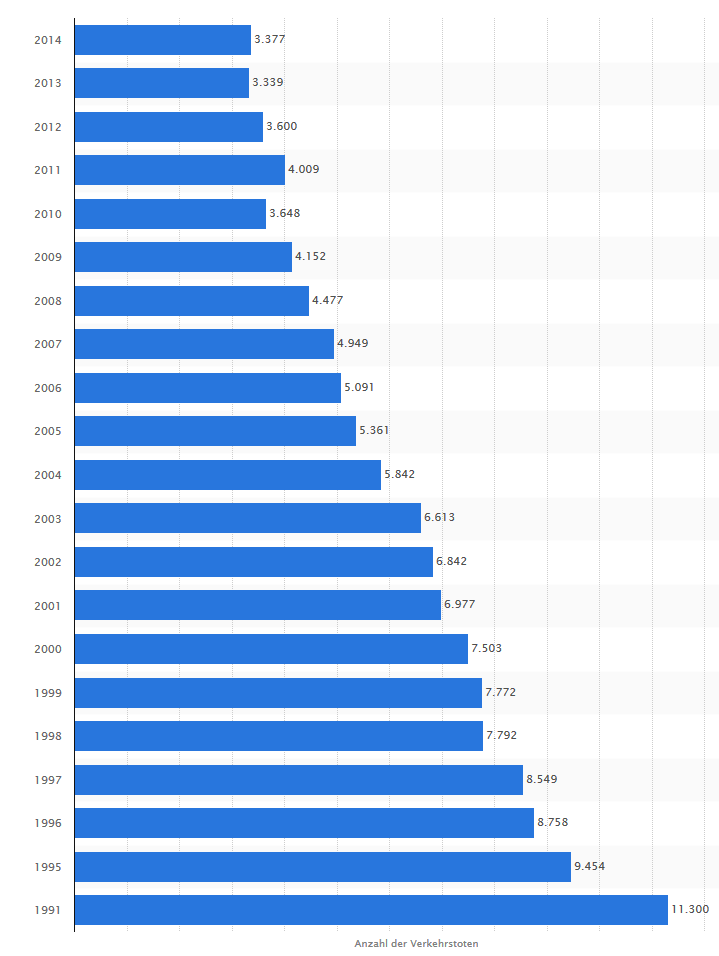
The US has roughly four times as many citizens as Germany and ten times more traffic deaths. Maybe you guys are driving more, but that can’t be explaining everything.
|
DCCARGEEK
> BigBlock440
10/15/2015 at 11:53 |
|
BigBlock is correct. Recent surveys, most visual surveys of drivers at red lights, have seat belt use at 89-90%.
The shocking part here, if you could call it that, is that automakers, government officials, and safety advocates are pouring time and energy into saving lives on the road, highlighting the total number of traffic fatalities, all while 52% of those dying in vehicle accidents don’t wear seat belts. Makes you question: should we even count those?
But there are errors in logic here - mainly that this point of view assumes the 52% of those killed unrestrained would have been saved had they been belted. To prove this we would have to look at each accident report and evidence and that isn’t going to happen.
|
BigBlock440
> Mark - Sixpots None The Richer
10/15/2015 at 12:14 |
|
Differences in licensing requirements probably has a lot to do with it too.
 Chris Clarke
> DCCARGEEK
Chris Clarke
> DCCARGEEK
10/15/2015 at 13:30 |
|
I’ve been writing my Congressman for years to outlaw daydreaming and driving. When will they wake up! Its for the children!
 John
> DCCARGEEK
John
> DCCARGEEK
10/15/2015 at 13:53 |
|
I’d also be curious to overlay weather conditions and day/night. I would guess most of us log the majority of our miles in daylight and optimal weather conditions so I’d expect to see most of the fatalities then but am curious if the numbers suggest rainy, nighttime etc. has statistical significance. Hopefully one day I can learn the most statistically safe time to drive!
 Ross Kraz
> DCCARGEEK
Ross Kraz
> DCCARGEEK
10/15/2015 at 13:57 |
|

Any chance we could see this curve vs. the number of drivers in each age demographic? I'd like to see if that has any correlation
|
DCCARGEEK
> Ross Kraz
10/15/2015 at 14:08 |
|
The data is there I just don’t think it’s in the same place. Federal Highway (FHWA) tracks DL’s age stats by state.
I’ll need to breakout fatalities by driver too if we want to see a correlation for driver using DLs.
|
DCCARGEEK
> John
10/15/2015 at 14:43 |
|
You could do that now but the data would only take into account fatalities and not overall crashes. Time of day, type of road, weather conditions and GIS are all included for each reported fatality.
If you could find a way to incorporate that into a trip planner it theoretically could provide you the safest route and time.
 Berang
> DCCARGEEK
Berang
> DCCARGEEK
10/15/2015 at 16:50 |
|
It’s interesting that seatbelt use is lowest amongst people in their 20s. (or at least people in their 20s who’ve crashed and died). I would have thought it’d be lowest in older generations who still see seatbelts as something weird and unnatural.
|
Mark - Sixpots None The Richer
> BigBlock440
10/15/2015 at 23:31 |
|
It’s a factor for sure. But it doesn’t explain why so many older - more experienced - people die in accidents.
Compare this to Germany’s statistics:
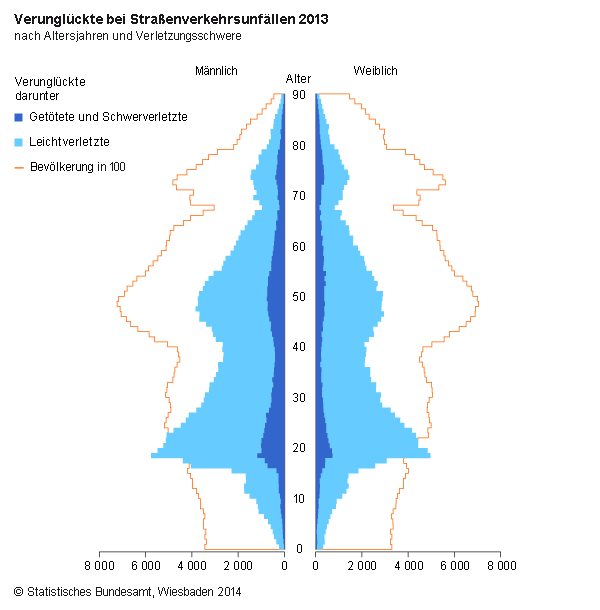
The amount of deaths/serious injuries and lighter injuries among younger people (dark and light blue) compared to their percentage on the total population (orange) is disproportionately high. It normalizes at about 40.
I think the US citizens have an attitude problem when it comes to driving. This means the US drivers seem more devil-may-care to me. Wearing seatbelts is less common for exampel.
And maybe there’s kind of a “cultural” lack of situational awareness/concentration behind the wheel because personal freedom is more important than watching out for each other? Perhaps there’s also a higher amount of DUI drivers? And there are more unsafe cars because there are less inspections.
 John the Wet Blanket
> DCCARGEEK
John the Wet Blanket
> DCCARGEEK
10/16/2015 at 09:31 |
|
I suggest the reason so many died going straight was that is when you are at the highest velocity. A truck once struck me going under 10kph and I was fine. If the truck had been going 30kph, I would have been badly injured or killed. Likewise, I crashed into a support beam once going about 10kph. I was rattled but fine. I would not have been fine at 80kph.