 "McMike" (mcmike)
10/22/2014 at 08:53 • Filed to: F1, infographic
 5
5
 1
1
 "McMike" (mcmike)
10/22/2014 at 08:53 • Filed to: F1, infographic |  5 5
|  1 1 |
I just came across this on another forum, and found it really neat.
http://charts.animateddata.co.uk/f1/
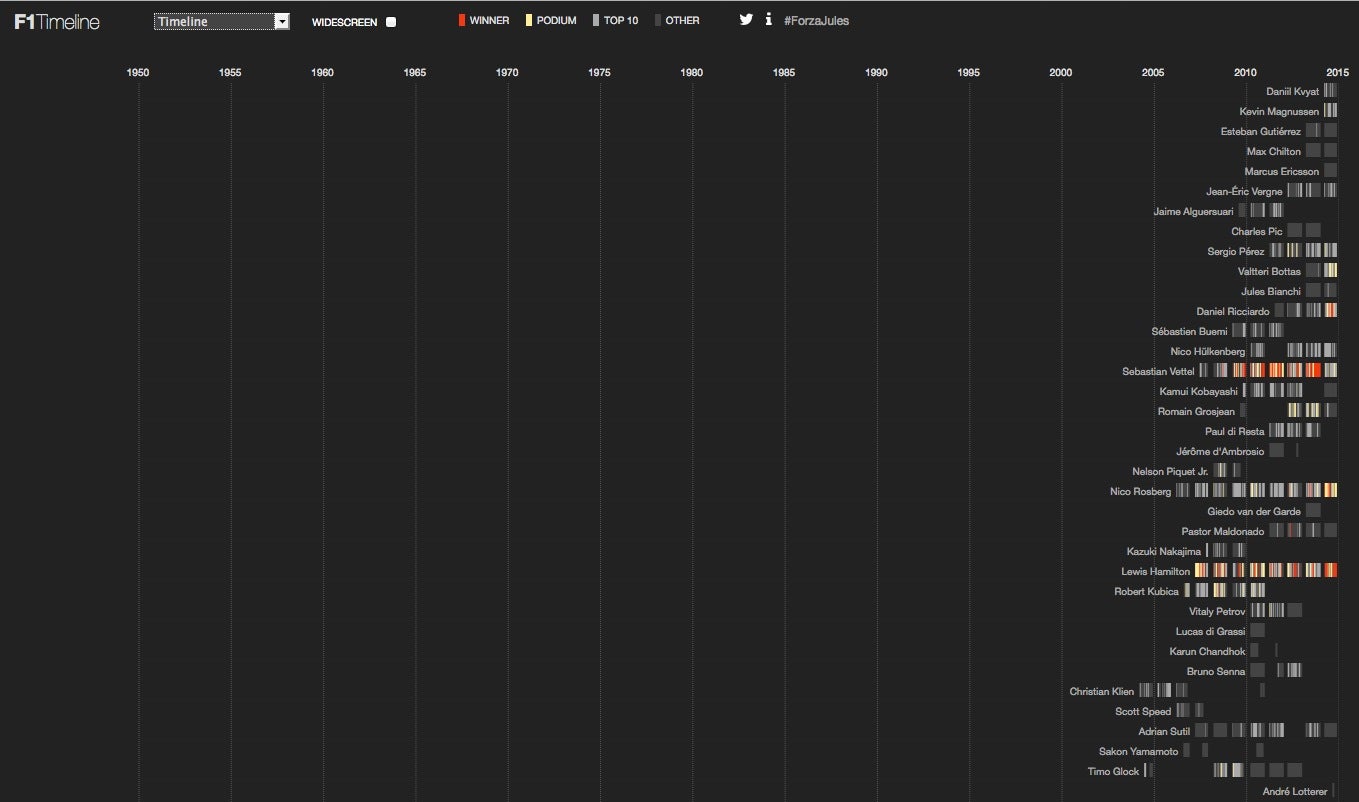
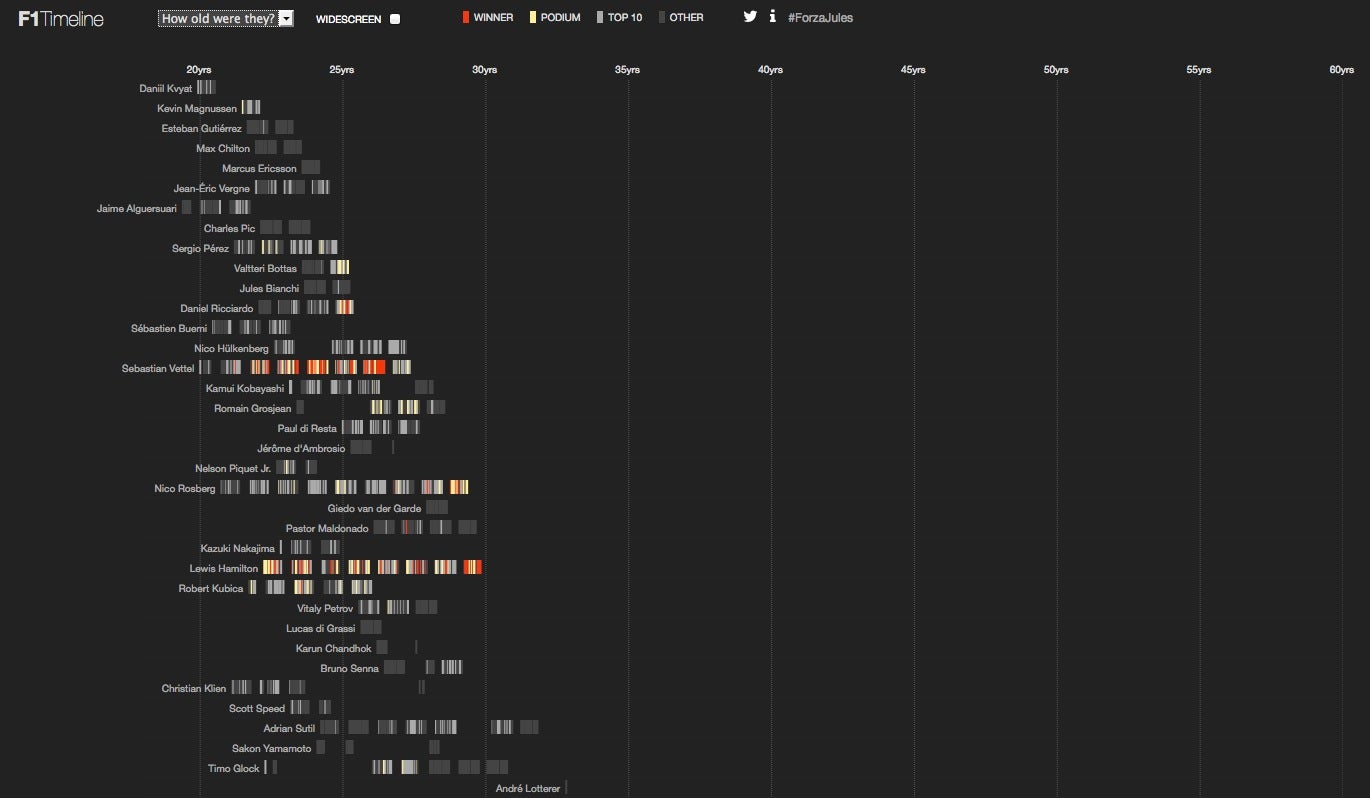
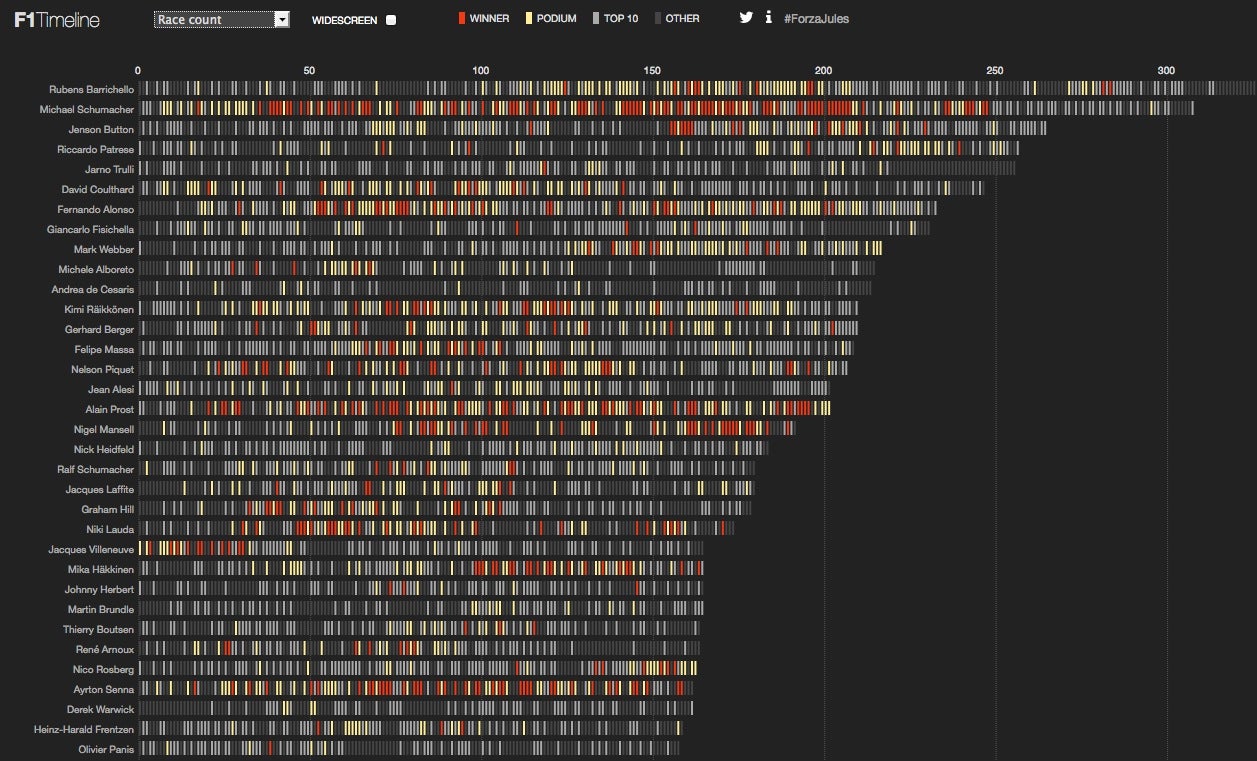
The shades of each mark represent a win, podium, or a top 10 finish, and it catagorizes every driver that ever participated in an F1 race. The datapoints are name, age, finish, and date. If you highlight over each mark, it will show what event it was.
It would be neat to sort it by number of wins, championships, etc, but it appears that it's locked to the timeline. Unfortunately, you can only sort the information three ways.
1) "Timeline"

2) "How old were They"

3) "Race Count"

Scroll through them, what do you find interesting about it?
 wabbalosthiskey
> McMike
10/22/2014 at 10:52 |
|
If you squint just right while starting at the last one, the stig appears?