 "Jake" (subyfreak)
10/02/2014 at 07:58 • Filed to: Speeding, tickets, jalopnik, oppositelock, subaru, wrx
 2
2
 7
7
 "Jake" (subyfreak)
10/02/2014 at 07:58 • Filed to: Speeding, tickets, jalopnik, oppositelock, subaru, wrx |  2 2
|  7 7 |
We've all seen it, and frankly the first 3 cars make pretty good sense -except I have no idea how the Mustang didn't end up on that list- but we all wondered how the Mercury Topaz or Suzuki Reno even made it, having been discontinued for years. Insurance.com claimed to have used a sample size over over 500,000 cars.
The real kicker comes when you also factor in the number of different cars on the road today, so for the purpose of science let's say there's 500 different models.
Okay so with 500 different cars, that leaves us with a sample size of 1000 cars per model. But this raises a few questions:
How are they coming about the sample size?
Are there even 1000 of those cars on the road today?
Are they using equal random sample sizes?
So, let's say they do use equal sample sizes; does that really make sense? A Ford F150, for example, has millions of units sold each year, where a WRX is a fraction of that. This makes comparing the two vehicles difficult without selecting a fair value for both. This value can be subjective though, as insurance.com might have not gone about picking the vehicles they were using in a fair manner.
Now, let's say that they didn't use equal sample sizes, but instead focused more on the percentage of each car. This makes an even bigger mess of everything. What if there are 300,000 Cadillac Escalades used in this experiment? That would make for a smaller sample size of each other vehicle. Let's say for the Mercury Topaz they used a sample size of 37 vehicles. So in order to reach their ticketed percentage of 28.8%, that would require 10.656 vehicles, or for the sake of this argument we'll say 11.
Now I don't know about everyone else, but 11 drivers out of 37 vehicles seems pretty average if you ask me. And by just a few more drivers getting tickets the percentage could easily be skewed.
I'm sure I'll have some opponents on my position, but I refuse to blindly follow these numbers they gave without actually knowing how the "experiment" was conducted.
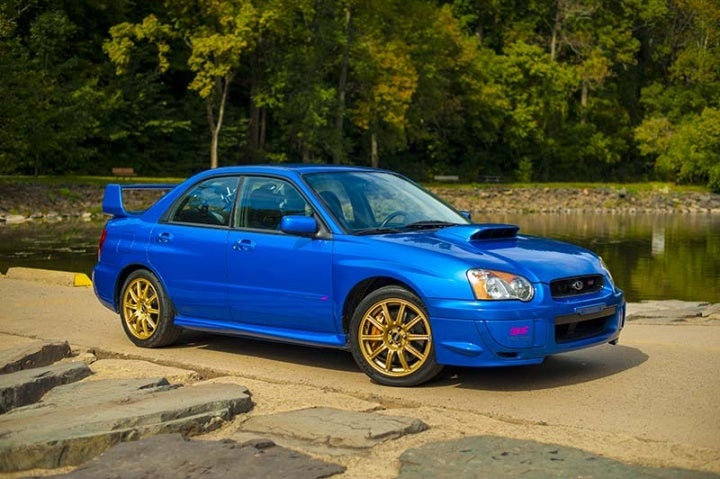
Photo via hooniverse.com

 mazdaspeed2
> Jake
10/02/2014 at 08:42 |
|
Excellent points!
 Jake
> mazdaspeed2
10/02/2014 at 09:00 |
|
Thanks! Someone's gotta call out the bs!
 mazdaspeed2
> Jake
10/02/2014 at 09:01 |
|
The topaz killed me though haha.
 jariten1781
> Jake
10/02/2014 at 09:05 |
|
I looked into it when the article first came out. It's based on quotes requested through their website which is a 'kayak like' insurance quote aggregator. Any model with more than 50 quote requests counted and they just did simple division. So yeah, there's nothing statistically significant about it at all.
Also, there's two types of people that are most likely to use an aggregator like that. Frugal ones, and people who have bad driving records and are forced to shop around because they can't afford quotes from the big guys. So that throws the percents as well.
 Jake
> jariten1781
10/02/2014 at 09:23 |
|
It's getting way too much recognition for what it is. Hell, even my high school statistics class could figure out that it's not a good representation.
 jariten1781
> Jake
10/02/2014 at 09:31 |
|
A better title would have been "Of people who used Insurance.com to ask for quotes, here's our raw data for models whose owners self reported recent tickets...note some owners may have requested more than one quote so they show in the data set twice and we didn't verify anything so even the raw results may not be representative of even our population".
If that were the title of the article no one would have read it. I suppose it worked out for them though since I now know that there's an insurance quote aggregator which I had no idea existed before.
 thebigbossyboss
> mazdaspeed2
10/02/2014 at 10:54 |
|
I had a Ford Tempo which was a Mercury topaz. 3 spd 92 hp. The car could barely crack 90 mph. Sure you could speed down residential streets, but not really on the highways.