 by "Dusty Ventures" (dustyventures)
Published 05/29/2017 at 14:31
by "Dusty Ventures" (dustyventures)
Published 05/29/2017 at 14:31
No Tags
STARS: 0
I’ve been working on a problem for a while, and unfortunately the solution is beyond me.
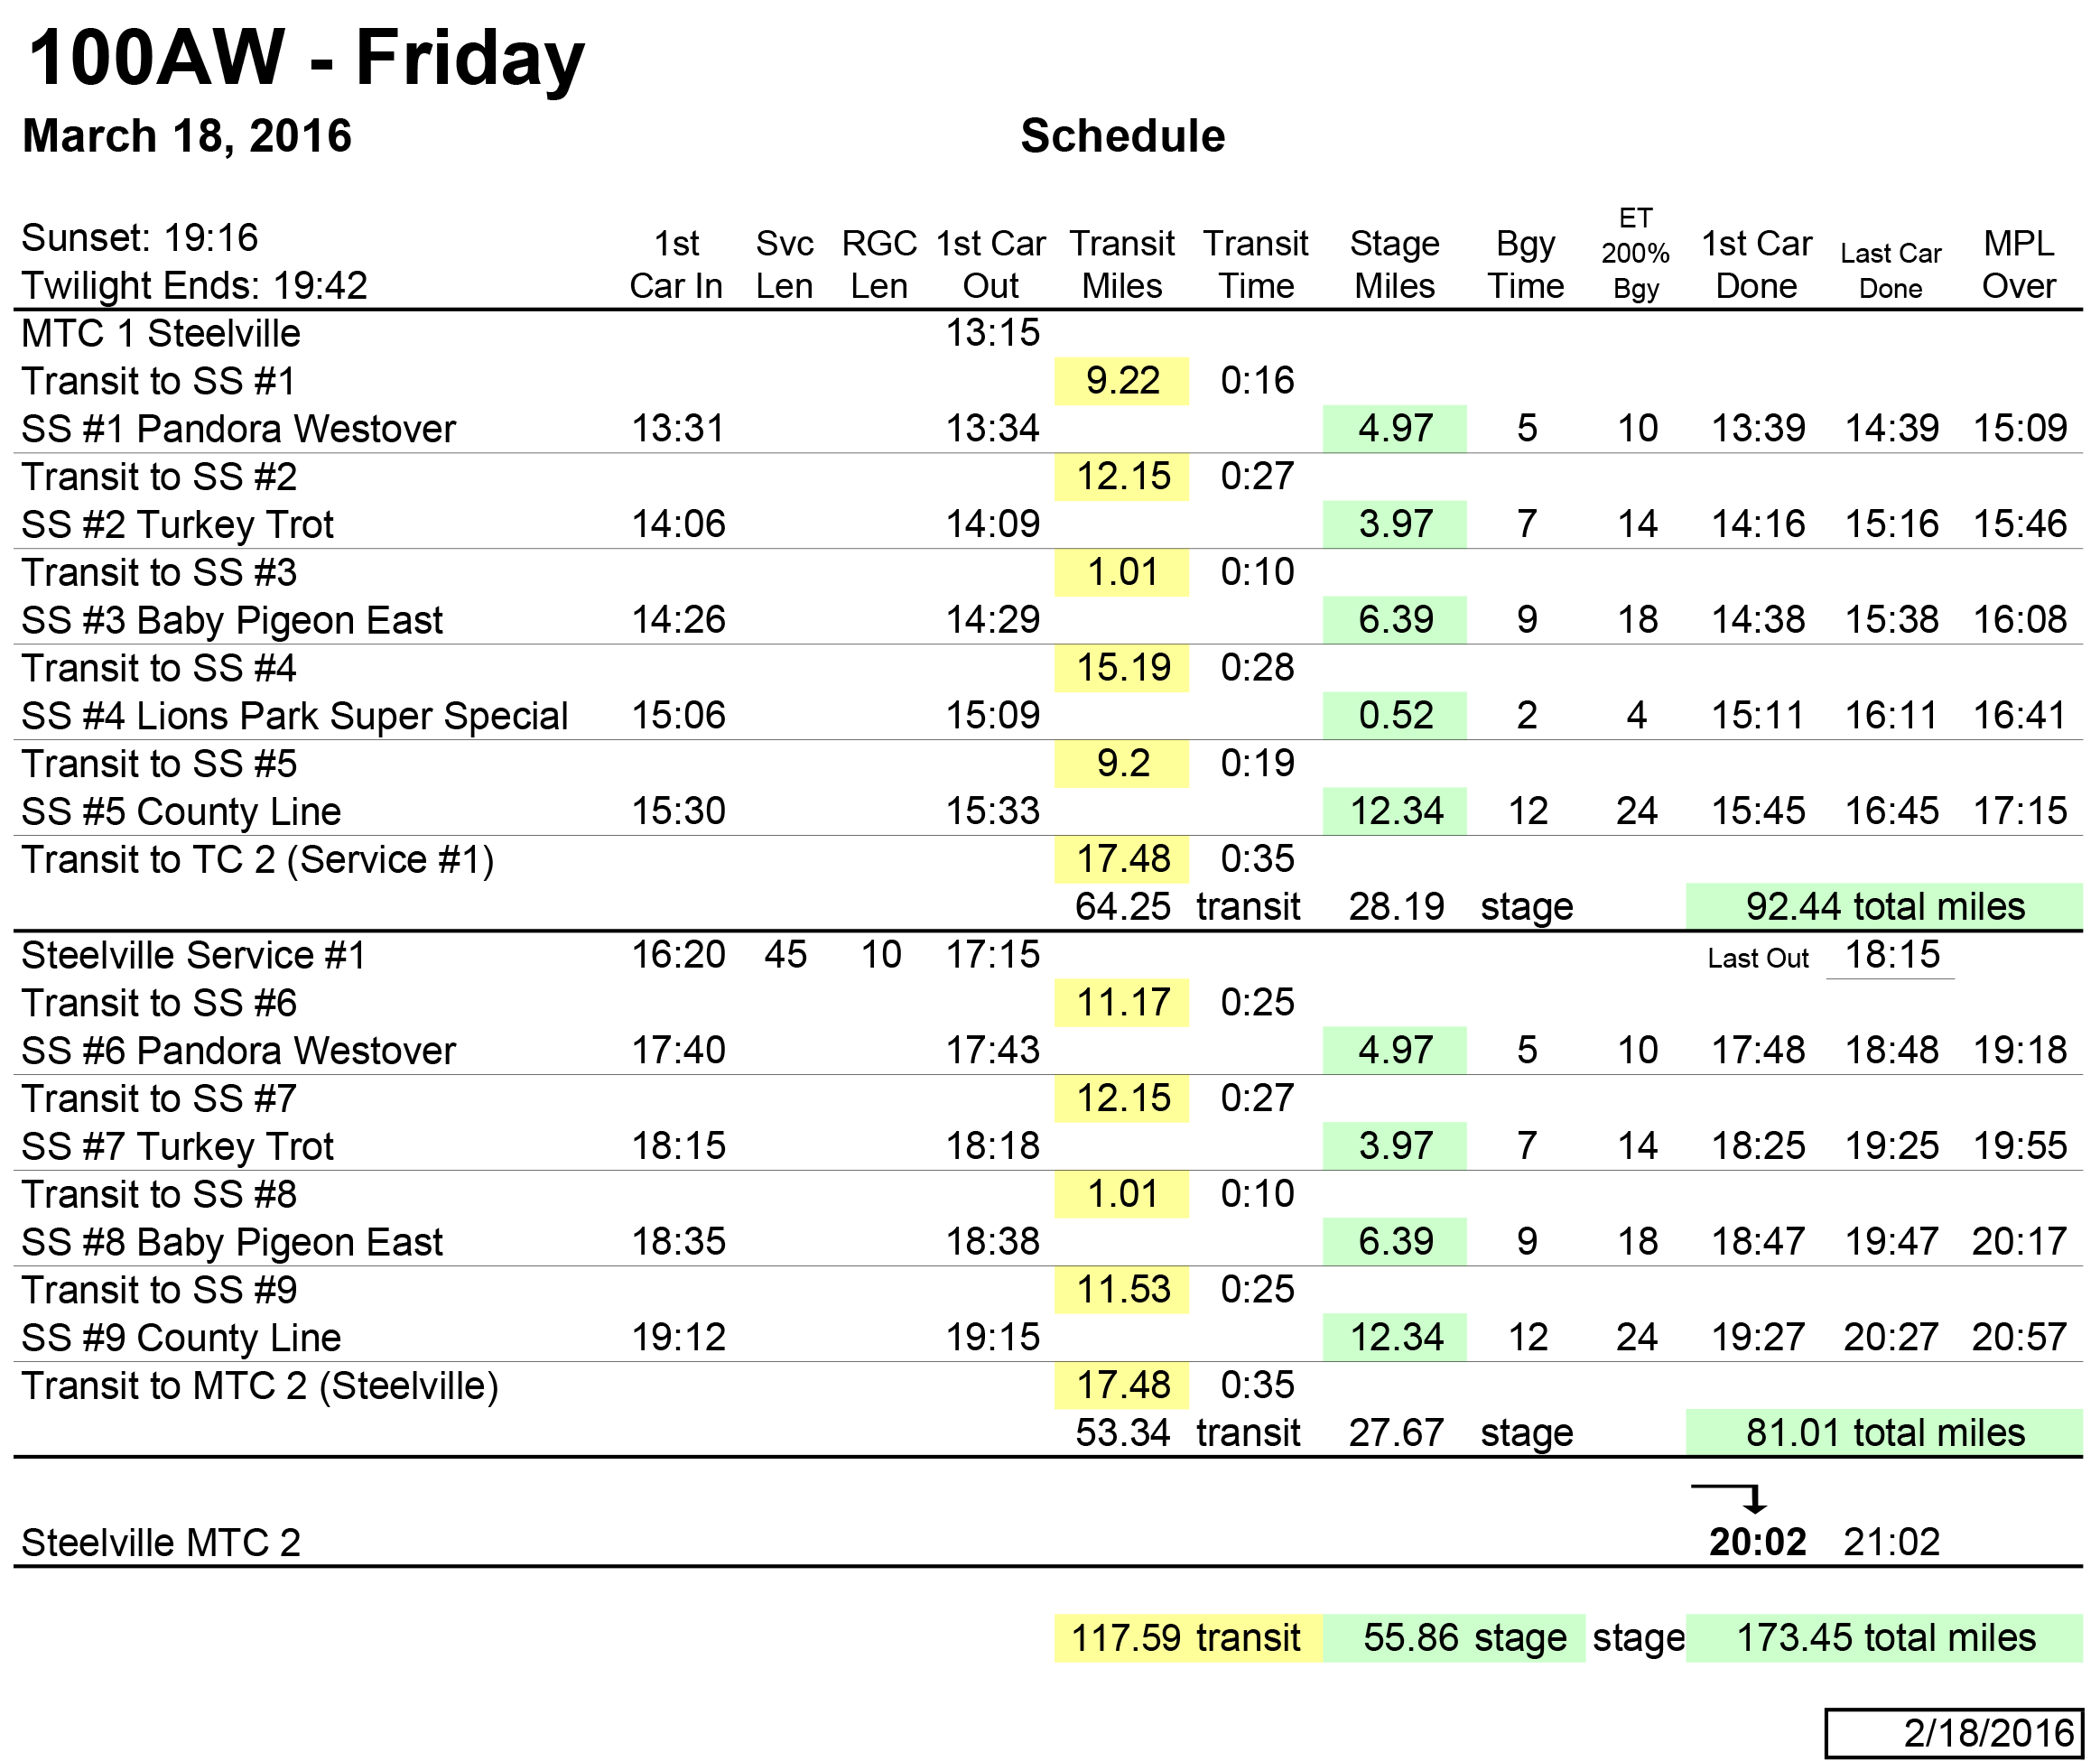
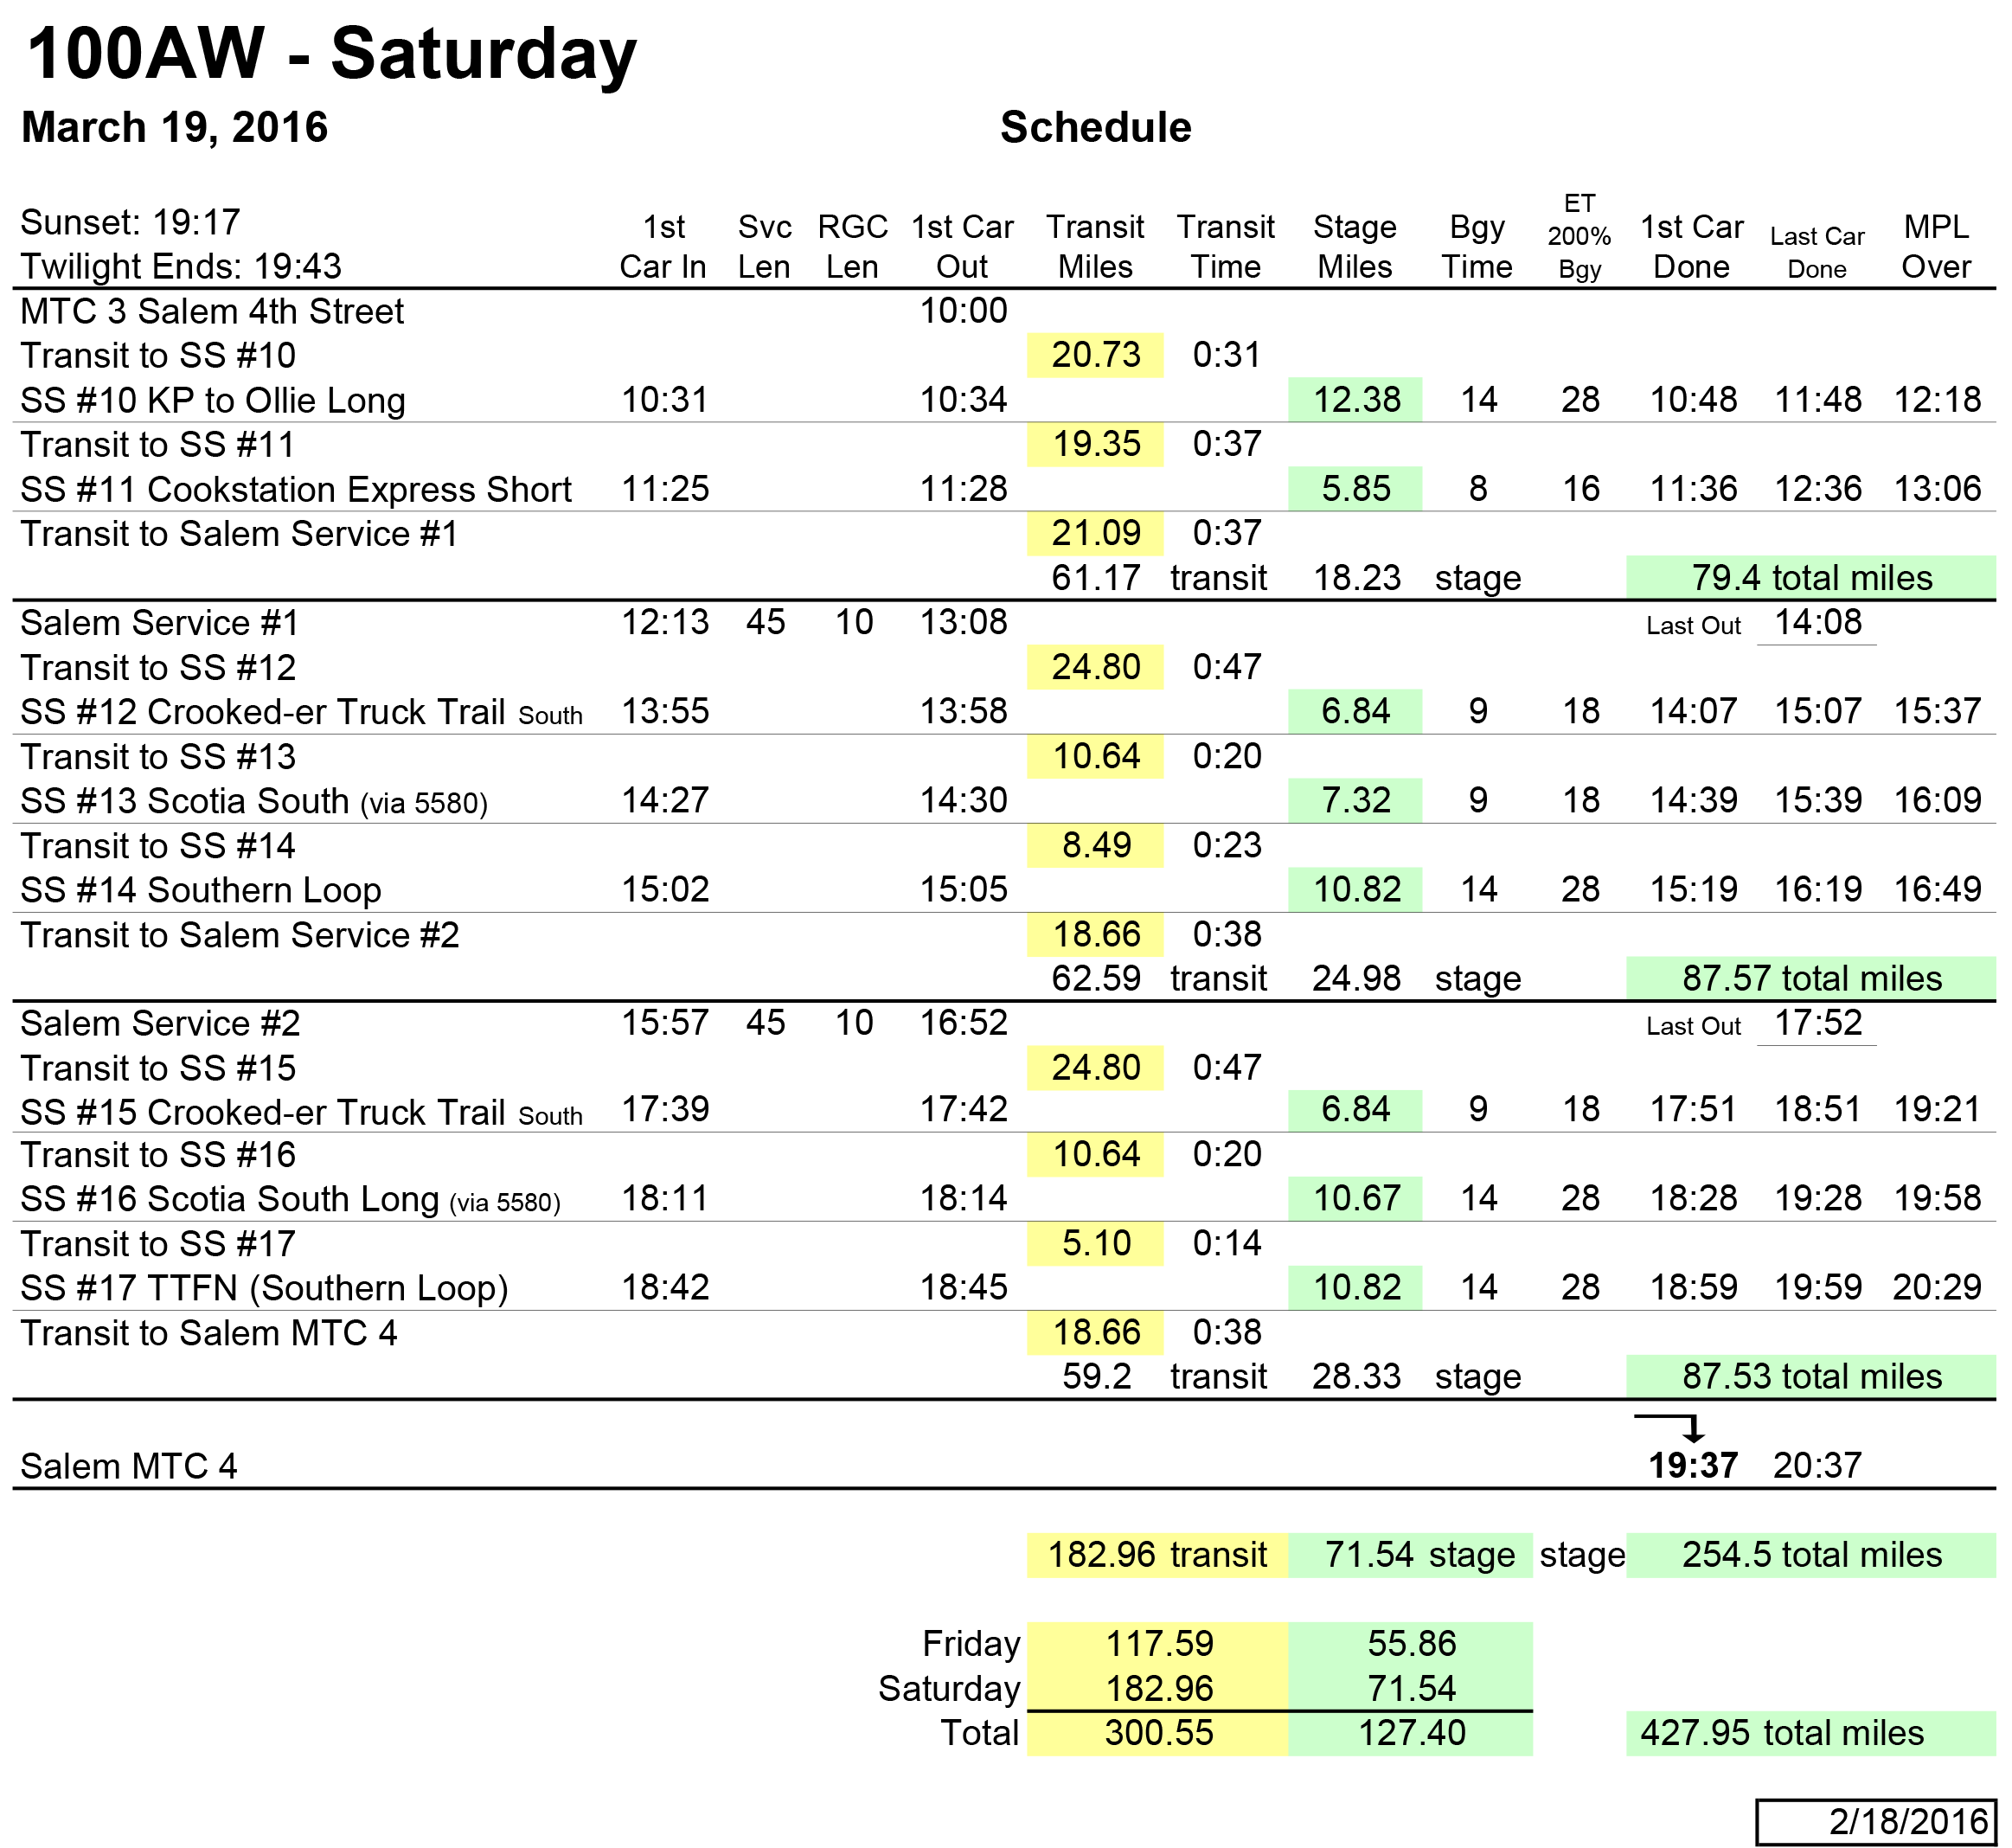
In rally each loop between services/refuels contains a certain number of stage miles and a certain number of transit miles. Naturally a car’s fuel economy driving flat out on stage is drastically different from its fuel economy driving the speed limit on transit. I’m fairly convinced that it’s theoretically possible to input the transit mileage, stage mileage, and fuel used into a table and, after enough data points, calculate fairly accurate transit and stage fuel economy. This would be incredibly useful as it would make it possible to look at the stage/transit mileage of upcoming loops and ensure a car has enough fuel on board to complete the loop while at the same time keeping from carrying too much unnecessary weight in the form of excess fuel. So here’s the challenge. Can anyone come up with a table that would actually solve this?
WRC refueling for your time
!!! UNKNOWN CONTENT TYPE !!!
EDIT: Here’s some mileage and weekend fuel numbers to test the table:
 "BvdV - The Dutch Engineer" (dutchengineer)
05/29/2017 at 14:41, STARS: 0
So you basically want two tables, one calculating stage fuel economy, and one calculating transit fuel economy. And another sheet in which you can enter stage and transit miles, leading to the expected amount of fuel needed? I think that’s not too hard, I think I could make something like that for you in MS Excel
 "OPPOsaurus WRX" (opposaurus)
05/29/2017 at 14:43, STARS: 1
U would probably be better off with miles per gallon. You probably know ur normal gpm. (Transit miles / transit gpm) + (race mile / race gpm) = total gallons needed
Disclaimer : this is a starting point. I’m at a cookout and don’t have the ability to test the theory
"Dusty Ventures" (dustyventures)
05/29/2017 at 14:46, STARS: 0
I want to be able to input the amount of fuel used on a loop (well, probably at least three or four loops, one or two loops would be insufficient for getting a reliable return) and the number of stage miles and transit miles in the loops, and have it return the stage and transit fuel economies.
 "Rusty Vandura - www.tinyurl.com/keepoppo" (rustyvandura)
05/29/2017 at 14:49, STARS: 0
I would love to try and help you with this. Do you still have my email address?
"Dusty Ventures" (dustyventures)
05/29/2017 at 14:51, STARS: 0
I’ve added some mileage and fuel use data above to test the tables. I’d want something that could take the info above and tell me what my stage and transit economy was for the weekend.
"Dusty Ventures" (dustyventures)
05/29/2017 at 14:52, STARS: 0
Somewhere. Probably easier if you emailed me. howdeedoodat@gmail.com
"BvdV - The Dutch Engineer" (dutchengineer)
05/29/2017 at 14:53, STARS: 0
Ah I see, that’s a bit harder than what I had in mind, but I will see what I can do.
 "Cash Rewards" (cashrewards)
05/29/2017 at 15:03, STARS: 0
Should be able to do something like A(stage miles)+B(transit miles)=total gallons used, where A is stage mpg, B is transit mpg. Take two sets, input and solve. Likely will have to do some interactions as this will jot work with real world numbers perfectly, since not every stage or transit is equal, and the mpg won’t be identical. But this is your basic setup that I can come up with on the toilet.
"Dusty Ventures" (dustyventures)
05/29/2017 at 15:07, STARS: 0
Total gallons used, stage miles, and transit miles are the numbers I know. It’s A and B I need to solve for.
 "Short-throw Granny Shifter is 2 #blessed 2b stressed" (cuneor)
05/29/2017 at 15:17, STARS: 1
If he collects enough data over the weekend, he should be able to plot in Excel and use the regression feature to find the average race and transit fuel economies.
Since the average weekend fuel economies are fixed by definition, but you essentially have three variable (transit dist, race dist, fuel usage) I would rearrange this equation to get two variables. Otherwise he would have to collect fuel usage after transit, and fuel usage after race I think.
Dusty, use Excel to plot race distance divided by transit distance as the x-variable, and fuel usage divided by total distance as your y-variable. Arrange in columns and plot the data. Use the regression tool to fit an equation, hopefully it’s linear, but a polynomial is fine too. Now you should have an equation showing the relationship between overall stage fuel economy vs the proportion of the stage that is race. Use the distances on your map to calculate future milage, and hence overall usage.
That is how I would do it anyway. This method won’t be a good predictor until you’ve collected enough data, since your actual milage will depend on individual race course and transit conditions.
"Cash Rewards" (cashrewards)
05/29/2017 at 15:34, STARS: 0
Exactly. Two unknowns, and two data sets gives you two equations. Just algebra from there. You’ll get slightly different each time since A and B are not absolutes, but a good guestimate at least.
"BvdV - The Dutch Engineer" (dutchengineer)
05/29/2017 at 15:46, STARS: 0
I managed to do it using the data analysis tool in Excel, still working on how to sort of automate it, will probably look into that tomorrow.
To what email adress can I send the finished file?
"Rusty Vandura - www.tinyurl.com/keepoppo" (rustyvandura)
05/29/2017 at 16:00, STARS: 0
I will. I am out of town now, returning home tomorrow. I have boo coo spreadsheet experience and I would love to lend a hand.
"Short-throw Granny Shifter is 2 #blessed 2b stressed" (cuneor)
05/29/2017 at 17:02, STARS: 0
So I went through the data using the method I left in the reply below. Here are my concerns:
-Five data points doesn’t seem like enough to find any sort of relationship due to the noise in the data collected. Look at loops 2 and 4. Even though significantly more of the total distance in loop 2 was “race”, you still returned around the same total economy. There are too many complicating factors that may not be readily quantifiable to find a good trend.
-A linear equation is not a good fit for the data I modeled below. Realistically, the relationship should be more like a backward S-curve, since there is a realistic minimum and maximum fuel economy if you did 100% race or 100% transit. A portion of this curve would be approximately linear, but there is not enough data to know how large this section is.
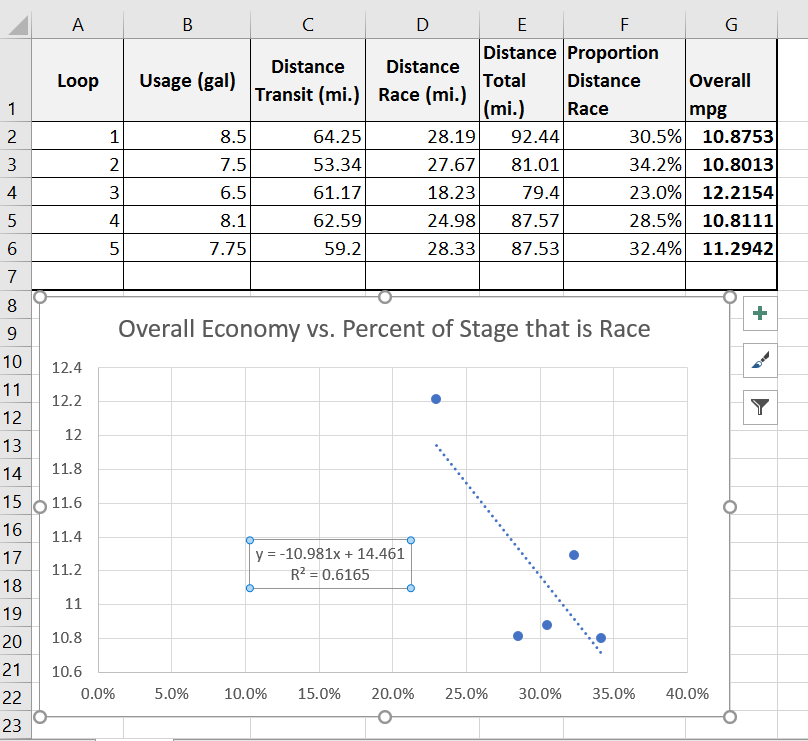
I think I am over-complicating this issue. Conservatively, you should just use the lowest overall fuel economy from the data you have already collected (10.8 mpg), and then multiply by the total loop distance to see if you have enough fuel. That would be the safest way to find calculate, and it would spare you from having to dig too deep into the data analysis tools in excel.
"Short-throw Granny Shifter is 2 #blessed 2b stressed" (cuneor)
05/29/2017 at 18:36, STARS: 0
Loop 2 and 3 seem to be the most extreme data, so using them to solve:
Fuel Use = Transity Economy * Transit Distance + Race Economy* Race Distance
1) 7.5 gal = A(53.35) + B(27.67)
2) 6.5 gal = A(61.17) + B(18.23)
gives A = 0.0599 gal/mile = 16.7 mpg, B = 0.1555 gal/mile = 6.43 mpg
I think your best bet is just to use excel to collect and plot the data like I did above, then just pick the two stages that seem to fit the trendline, and then use them to solve the pair of equations like I did above. You can use excel to solve the pair quickly using matrices, the =MINVERSE and =MMULT functions.
Someone on here should be able to automate that using excel. The only issue I’m having finding a way to used conditional statements to pull the data from the list, and put it into an array that can be solved as a 2x2 matrix.