 by "SHARPSPEED" (SHARPSPEED)
Published 05/22/2017 at 22:33
by "SHARPSPEED" (SHARPSPEED)
Published 05/22/2017 at 22:33
No Tags
STARS: 1
 "Milky" (jordanmielke)
05/22/2017 at 22:38, STARS: 2
Just a reminder that theres a huge gap between fences with a lot people that don’t care.
 "OPPOsaurus WRX" (opposaurus)
05/22/2017 at 22:40, STARS: 3

two bowls of nuts
 "My citroen won't start" (lucasboechat)
05/22/2017 at 22:59, STARS: 0
Except one side has religious cuckoos
 "CB" (jrcb)
05/22/2017 at 23:12, STARS: 2
Oh come on, dude, like the other side doesn’t have its fair share of nutjobs.
 "Dusty Ventures" (dustyventures)
05/22/2017 at 23:12, STARS: 4
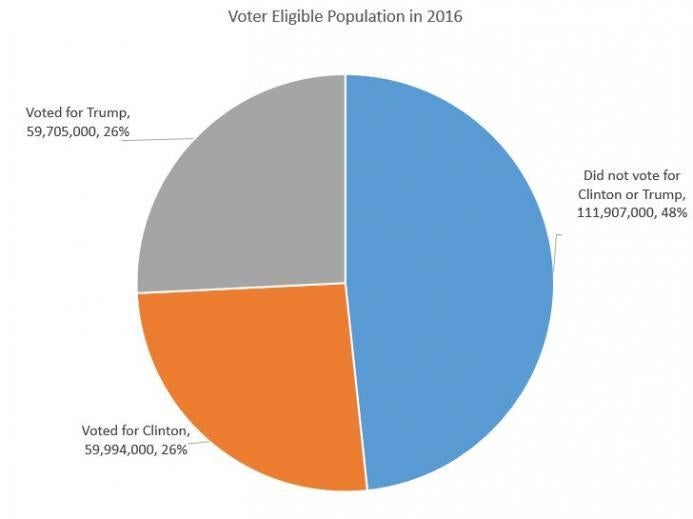
I don’t know about the “voted for neither” figures, but the “voted for Trump” and “voted for Clinton” numbers aren’t even close to accurate on that. Correct numbers would be 62,979,636 Trump, 65,844,610 Clinton
"Milky" (jordanmielke)
05/22/2017 at 23:25, STARS: 1
I guess it really is a dumb graph. I did just find somewhere that 92 million eligible voters, didn’t. Also that 2.3 million people that did vote, didn’t vote for the president.
 "ptak appreciates old racecars" (racecarptak)
05/23/2017 at 06:15, STARS: 2

mfw two party system
 "Scott" (merl3noir)
05/23/2017 at 07:07, STARS: 0
Even though the numbers are off, I’d say the basic premise is correct. There are over 320 Million people in the US. Obviously some do not qualify as eligible voters, they are less than 18yo or are convicted felons that have had their right to vote taken away. But since according to Dusty Ventures number almost 129million people voted for Trump or Hillary, that means either there was a lot of voters that are not eligible, or there is a lot more than 92 million eligible voters. However it does mean that out of the population of the US just barely over 1/3rd voted for Hillary or Trump. The remaining almost 2/3rds are either not eligible to vote so who knows how they would have voted if eligible, or they choose to vote for none of the above, by not voting. And then you have the millions that voted for a 3rd party candidate. So in all likely hood, the blue did not vote for Hillary or Trump, need to be bigger.
I believe most definitions of eligible voters, are people that meet age, citizenship and have not lost their voting right due to felony convictions. Registered voters would certainly be a much smaller group, but even many registered voters did not vote.
Also in regards to the main post above. Typically a little over 1/3rd of the population say they are D’s. Less than 1/3rd say they are R’s. And about 1/3rd want nothing to do with either party. But even among the D’s and R’s you have people who just tend to vote but are turned off by the bitter partisanship of even the party they generally support. So yeah, I would say how ever you want to analyze it, your graph likely underestimates the people who don’t give a crap about either.
"Dusty Ventures" (dustyventures)
05/23/2017 at 09:01, STARS: 0
Just did a quick Google search, there are about 200 million registered voters